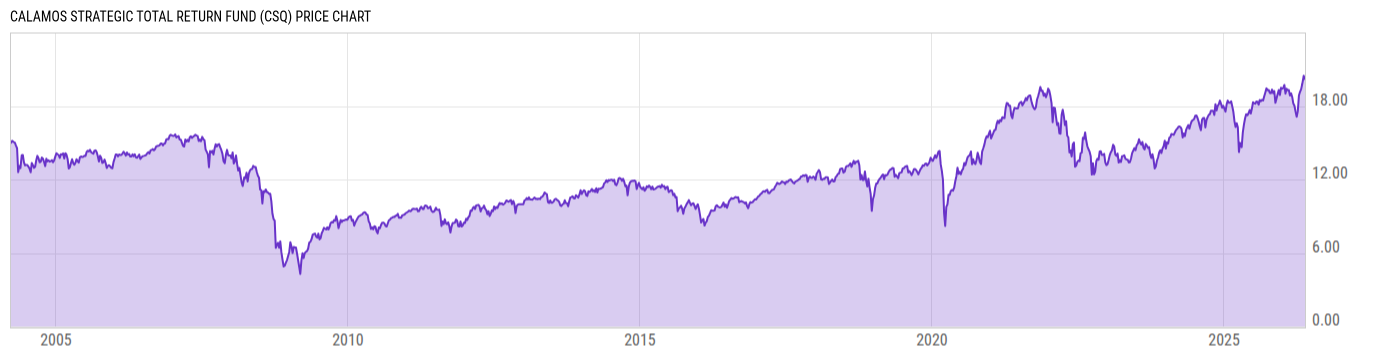
Calamos Strategic Total Return (CSQ)
15.84
-0.06 (-0.38%)
USD |
NASDAQ |
Aug 16, 16:00
15.86
+0.02 (+0.13%)
After-Hours: 20:00
Price Chart
Key Stats
Customize
Expense Ratio | Discount or Premium to NAV | Total Assets Under Management | 30-Day Average Daily Volume |
---|---|---|---|
2.03% | 1.41% | 2.464B | 271340.6 |
Dividend Yield | Turnover Ratio | 1 Year Fund Level Flows | Max Drawdown (All) |
0.90% | 27.00% | -102.48M | Upgrade |
Basic Info
Investment Strategy | |
The investments are primarily made in equity securities of common and preferred stocks, convertible and income producing securities. Normally it will invest at least 50% of its managed assets in equity securities (including securities that are convertible into equity securities). It may invest up to 35% of its assets in foreign securities, including debt and equity securities of corporations and governments of developed and emerging markets. Up to 15% of its managed assets may be invested in emerging markets. Up to 15% of its managed assets may be invested in securities that are illiquid at the time of investment. |
General | |
Security Type | Closed-End Fund |
Equity Style | Large Cap/Blend |
Fixed Income Style | -- |
Broad Asset Class | Allocation |
Broad Category | Allocation |
Category Name | Allocation--70% to 85% Equity |
Category Index | Morningstar Mod Agg Tgt Risk TR USD |
Prospectus Objective | Growth and Income |
Fund Owner Firm Name | Calamos Asset Management Inc |
Prospectus Benchmark Index | |
S&P 500 TR USD | 100.0% |
Broad Asset Class Benchmark Index | |
^SPXTR | 100.0% |
Manager Tenure | |
John Calamos | 18.36 yrs |
Jon Vacko | 14.78 yrs |
Dennis Cogan | 6.61 yrs |
Eli Pars | 6.61 yrs |
Joe Wysocki | 6.61 yrs |
R. Matthew Freund | 5.65 yrs |
Net Fund Flows Versus Category
1 Month
% Rank:
--
--
Category Low
--
Category High
1 Year
% Rank:
69
-102.48M
-2.856B
Category Low
831.33M
Category High
3 Months
% Rank:
--
--
Category Low
--
Category High
3 Years
% Rank:
--
--
Category Low
--
Category High
6 Months
% Rank:
--
--
Category Low
--
Category High
5 Years
% Rank:
--
--
Category Low
--
Category High
YTD
% Rank:
--
--
Category Low
--
Category High
10 Years
% Rank:
--
--
Category Low
--
Category High
As of January 31, 2012
Performance Versus Category
As of August 16, 2022. Returns for periods of 1 year and above are annualized.
Annual Total Returns Versus Peers
As of August 16, 2022.
Asset Allocation
Top 10 Holdings
Name | % Weight | Price | % Change |
---|---|---|---|
Apple Inc | 4.99% | 173.03 | -0.09% |
Microsoft Corp | 4.76% | 292.71 | -0.26% |
Alphabet Inc Class A | 2.32% | 121.70 | -0.31% |
Amazon.com Inc | 2.12% | 144.78 | 1.12% |
UnitedHealth Group Inc | 1.65% | 546.12 | 0.27% |
Johnson & Johnson | 1.37% | 167.57 | 0.89% |
Exxon Mobil Corp | 1.13% | 91.46 | -0.93% |
2020 Cash Mandatory Exchangeable Trust 0%
|
1.13% | -- | -- |
United States Treasury Notes 2.25%
|
1.12% | -- | -- |
Eli Lilly and Co | 1.09% | 310.31 | -1.16% |
News
Headline
Wire
Time (ET)
PR Newswire
08/01 16:05
PR Newswire
07/01 16:05
PR Newswire
06/01 16:05
PR Newswire
05/02 16:05
PR Newswire
04/01 16:05
PR Newswire
03/01 16:05
PR Newswire
02/01 16:05
Basic Info
Investment Strategy | |
The investments are primarily made in equity securities of common and preferred stocks, convertible and income producing securities. Normally it will invest at least 50% of its managed assets in equity securities (including securities that are convertible into equity securities). It may invest up to 35% of its assets in foreign securities, including debt and equity securities of corporations and governments of developed and emerging markets. Up to 15% of its managed assets may be invested in emerging markets. Up to 15% of its managed assets may be invested in securities that are illiquid at the time of investment. |
General | |
Security Type | Closed-End Fund |
Equity Style | Large Cap/Blend |
Fixed Income Style | -- |
Broad Asset Class | Allocation |
Broad Category | Allocation |
Category Name | Allocation--70% to 85% Equity |
Category Index | Morningstar Mod Agg Tgt Risk TR USD |
Prospectus Objective | Growth and Income |
Fund Owner Firm Name | Calamos Asset Management Inc |
Prospectus Benchmark Index | |
S&P 500 TR USD | 100.0% |
Broad Asset Class Benchmark Index | |
^SPXTR | 100.0% |
Manager Tenure | |
John Calamos | 18.36 yrs |
Jon Vacko | 14.78 yrs |
Dennis Cogan | 6.61 yrs |
Eli Pars | 6.61 yrs |
Joe Wysocki | 6.61 yrs |
R. Matthew Freund | 5.65 yrs |
Fundamentals
General | |
Distribution Yield | Upgrade |
Dividend Yield TTM (8-16-22) | 0.90% |
30-Day SEC Yield | -- |
7-Day SEC Yield | -- |
Number of Holdings | Upgrade |
Stock | |
Weighted Average PE Ratio | 18.43 |
Weighted Average Price to Sales Ratio | Upgrade |
Weighted Average Price to Book Ratio | Upgrade |
Weighted Median ROE | Upgrade |
Weighted Median ROA | Upgrade |
Forecasted Dividend Yield | Upgrade |
Forecasted PE Ratio | Upgrade |
Forecasted Price to Sales Ratio | Upgrade |
Forecasted Price to Book Ratio | Upgrade |
Bond | |
Current Yield | 4.14% |
Yield to Maturity | -- |
Effective Duration | Upgrade |
Average Coupon | Upgrade |
Average Credit Score | Upgrade |
Average Price | -- |
As of June 30, 2022
Risk Info
Fund Details
Key Dates | |
Inception Date | 3/26/2004 |
Last Annual Report Date | 10/31/2021 |
Last Prospectus Date | 3/25/2004 |
Attributes | |
Enhanced Index Fund | No |
Index Fund | No |
Inverse Fund | No |
Leveraged Fund |
|
Fund of Funds | No |
Currency Hedged Fund | No |
Synthetic Replication Fund | No |
Has Dividend Investment Plan |
|
Socially Responsible Fund | No |
News
Headline
Wire
Time (ET)
PR Newswire
08/01 16:05
PR Newswire
07/01 16:05
PR Newswire
06/01 16:05
PR Newswire
05/02 16:05
PR Newswire
04/01 16:05
PR Newswire
03/01 16:05
PR Newswire
02/01 16:05