

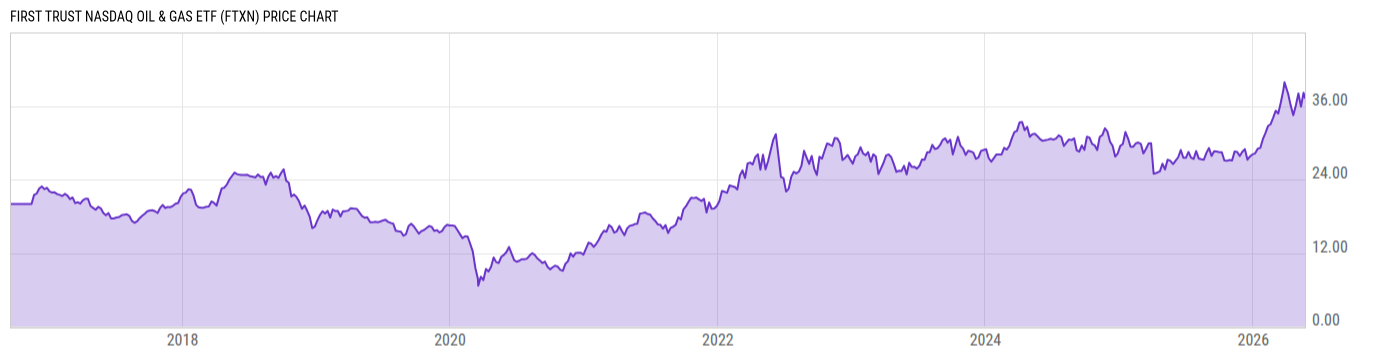
First Trust Nasdaq Oil & Gas ETF (FTXN)
35.84
-0.65
(-1.77%)
USD |
NASDAQ |
Jun 09, 16:00
35.84
0.00 (0.00%)
After-Hours: 16:44
Price Chart
Key Stats
| Net Expense Ratio | Discount or Premium to NAV | Total Assets Under Management | 30-Day Average Daily Volume |
|---|---|---|---|
| 0.60% | 0.03% | 977.39M | 1.325M |
| Weighted Average Dividend Yield | Turnover Ratio (Generic) | 1 Year Fund Level Flows | Max Drawdown (Since Inception) |
| 2.38% | 32.00% | 784.52M |
Basic Info
| Investment Strategy | |
| The Fund seeks investment results that correspond generally to the price and yield (before the Funds fees and expenses) of the Nasdaq US Smart Oil & Gas Index. Under normal circumstances, the Fund invests at least 90% of its net assets (including investment borrowings) in common stocks that comprise the Index. |
| General | |
| Security Type | Exchange-Traded Fund |
| Equity Style | Multi Cap Value |
| Broad Asset Class | Sector Equity |
| Broad Category | Equity |
| Global Peer Group | Equity Theme - Natural Resources |
| Peer Group | Natural Resources Funds |
| Global Macro | Equity Theme |
| US Macro | Sector Equity Funds |
| YCharts Categorization | -- |
| YCharts Benchmark | -- |
| Prospectus Objective | Natural Resources Funds |
| Fund Owner Firm Name | First Trust |
| Broad Asset Class Benchmark Index | |
| ^MSWNTR | 100.0% |
Performance Versus Peer Group
Annual Total Returns Versus Peers
As of June 09, 2026.
Asset Allocation
As of May 31, 2026.
| Type | % Net |
|---|---|
| Cash | 0.23% |
| Stock | 99.81% |
| Bond | 0.00% |
| Convertible | 0.00% |
| Preferred | 0.00% |
| Other | -0.04% |
Basic Info
| Investment Strategy | |
| The Fund seeks investment results that correspond generally to the price and yield (before the Funds fees and expenses) of the Nasdaq US Smart Oil & Gas Index. Under normal circumstances, the Fund invests at least 90% of its net assets (including investment borrowings) in common stocks that comprise the Index. |
| General | |
| Security Type | Exchange-Traded Fund |
| Equity Style | Multi Cap Value |
| Broad Asset Class | Sector Equity |
| Broad Category | Equity |
| Global Peer Group | Equity Theme - Natural Resources |
| Peer Group | Natural Resources Funds |
| Global Macro | Equity Theme |
| US Macro | Sector Equity Funds |
| YCharts Categorization | -- |
| YCharts Benchmark | -- |
| Prospectus Objective | Natural Resources Funds |
| Fund Owner Firm Name | First Trust |
| Broad Asset Class Benchmark Index | |
| ^MSWNTR | 100.0% |