

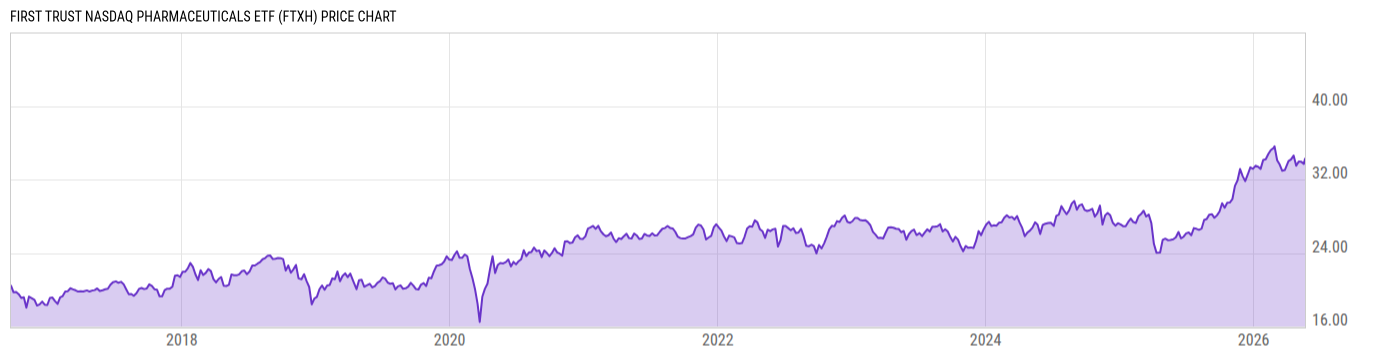
First Trust Nasdaq Pharmaceuticals ETF (FTXH)
35.12
-0.32
(-0.91%)
USD |
NASDAQ |
Jun 08, 16:00
Price Chart
Key Stats
| Net Expense Ratio | Discount or Premium to NAV | Total Assets Under Management | 30-Day Average Daily Volume |
|---|---|---|---|
| 0.60% | -0.02% | 35.13M | 6531.80 |
| Weighted Average Dividend Yield | Turnover Ratio (Generic) | 1 Year Fund Level Flows | Max Drawdown (Since Inception) |
| 1.47% | 28.00% | 8.502M |
Basic Info
| Investment Strategy | |
| The Fund seeks investment results that correspond generally to the price and yield (before the Funds fees and expenses) of an equity index called the Nasdaq US Smart Pharmaceuticals Index. The Fund normally invests at least 90% of its net assets (including investment borrowings) in common stocks that comprise the Index. |
| General | |
| Security Type | Exchange-Traded Fund |
| Equity Style | Multi Cap Core |
| Broad Asset Class | Sector Equity |
| Broad Category | Equity |
| Global Peer Group | Equity Sector Healthcare |
| Peer Group | Health/Biotechnology Funds |
| Global Macro | Equity Industry Sector |
| US Macro | Sector Equity Funds |
| YCharts Categorization | -- |
| YCharts Benchmark | -- |
| Prospectus Objective | Health/Biotechnology Funds |
| Fund Owner Firm Name | First Trust |
| Broad Asset Class Benchmark Index | |
| ^MSWNTR | 100.0% |
Performance Versus Peer Group
Annual Total Returns Versus Peers
As of June 09, 2026.
Asset Allocation
As of May 31, 2026.
| Type | % Net |
|---|---|
| Cash | 0.25% |
| Stock | 99.80% |
| Bond | 0.00% |
| Convertible | 0.00% |
| Preferred | 0.00% |
| Other | -0.05% |
Basic Info
| Investment Strategy | |
| The Fund seeks investment results that correspond generally to the price and yield (before the Funds fees and expenses) of an equity index called the Nasdaq US Smart Pharmaceuticals Index. The Fund normally invests at least 90% of its net assets (including investment borrowings) in common stocks that comprise the Index. |
| General | |
| Security Type | Exchange-Traded Fund |
| Equity Style | Multi Cap Core |
| Broad Asset Class | Sector Equity |
| Broad Category | Equity |
| Global Peer Group | Equity Sector Healthcare |
| Peer Group | Health/Biotechnology Funds |
| Global Macro | Equity Industry Sector |
| US Macro | Sector Equity Funds |
| YCharts Categorization | -- |
| YCharts Benchmark | -- |
| Prospectus Objective | Health/Biotechnology Funds |
| Fund Owner Firm Name | First Trust |
| Broad Asset Class Benchmark Index | |
| ^MSWNTR | 100.0% |