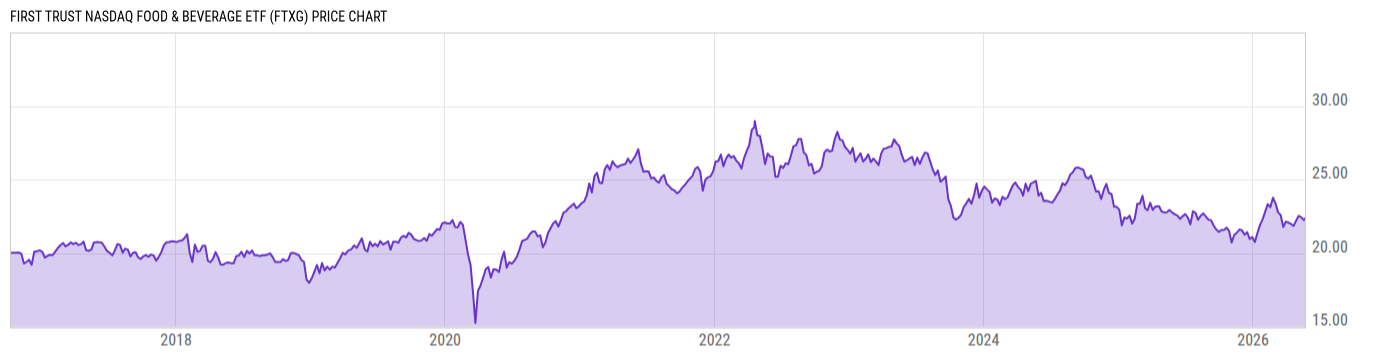
First Trust Nasdaq Food & Beverage ETF (FTXG)
26.88
+0.12
(+0.45%)
USD |
NASDAQ |
Mar 31, 16:00
26.94
+0.06
(+0.22%)
After-Hours: 20:00
Key Stats
Expense Ratio | Discount or Premium to NAV | Total Assets Under Management | 30-Day Average Daily Volume |
---|---|---|---|
0.60% | -0.19% | 975.23M | 255997.6 |
Dividend Yield | Turnover Ratio | 1 Year Fund Level Flows | Max Drawdown (All) |
1.42% | 77.00% | 1.074B | Upgrade |
Basic Info
Investment Strategy | |
The investment seeks investment results that correspond generally to the price and yield (before the fund's fees and expenses) of an equity index called the Nasdaq US Smart Food & Beverage IndexTM. The fund will normally invest at least 90% of its net assets (including investment borrowings) in the common stocks and depository receipts that comprise the underlying index. The index is designed to provide exposure to U.S. companies comprising the food and beverage sector that have been selected based upon their liquidity and weighted based upon their cumulative score on three investing factors: volatility, value and growth. The fund is non-diversified. |
General | |
Security Type | Exchange-Traded Fund |
Equity Style | Mid Cap/Blend |
Fixed Income Style | -- |
Broad Asset Class | Sector Equity |
Broad Category | Equity |
Category Name | Consumer Defensive |
Category Index | S&P 1500 Cons Staples TR |
Global Category Name | Consumer Goods & Services Sector Equity |
YCharts Categorization | Consumer Services Equity |
YCharts Benchmark | S&P 1500 Consumer Staples (Sector) Total Return (^SP15CNSSTR) |
Prospectus Objective | Specialty - Unaligned |
Fund Owner Firm Name | First Trust |
Prospectus Benchmark Index | |
Nasdaq US Smart Food&Beverage TR USD | 100.0% |
Broad Asset Class Benchmark Index | |
^MSWNTR | 100.0% |
Manager Tenure | |
Chris Peterson | 6.45 yrs |
Daniel Lindquist | 6.45 yrs |
David McGarel | 6.45 yrs |
Jon Erickson | 6.45 yrs |
Roger Testin | 6.45 yrs |
Stan Ueland | 6.45 yrs |
Erik Russo | 2.16 yrs |
Net Fund Flows Versus Category
1 Month
% Rank:
--
--
Category Low
--
Category High
1 Year
% Rank:
8
1.074B
-124.35M
Category Low
1.706B
Category High
3 Months
% Rank:
--
--
Category Low
--
Category High
3 Years
% Rank:
--
--
Category Low
--
Category High
6 Months
% Rank:
--
--
Category Low
--
Category High
5 Years
% Rank:
--
--
Category Low
--
Category High
YTD
% Rank:
--
--
Category Low
--
Category High
10 Years
% Rank:
--
--
Category Low
--
Category High
As of February 28, 2023
Risk
Performance Versus Category
As of March 31, 2023. Returns for periods of 1 year and above are annualized.
Annual Total Returns Versus Peers
As of March 31, 2023.
Asset Allocation
Top 10 Holdings
Name | % Weight | Price | % Change |
---|---|---|---|
Mondelez International Inc Class A | 8.31% | 69.72 | 0.20% |
General Mills Inc | 8.23% | 85.46 | 0.59% |
PepsiCo Inc | 8.02% | 182.30 | 0.81% |
Coca-Cola Co | 8.00% | 62.03 | 0.29% |
Archer-Daniels Midland Co | 7.64% | 79.66 | 0.24% |
JM Smucker Co | 4.10% | 157.37 | -0.11% |
The Hershey Co | 4.08% | 254.41 | 0.44% |
Campbell Soup Co | 4.00% | 54.98 | 1.07% |
Conagra Brands Inc | 3.97% | 37.56 | 0.45% |
Keurig Dr Pepper Inc | 3.93% | 35.28 | 0.43% |
News
Headline
Wire
Time (ET)
SA Breaking News
02/10 16:27
SA Breaking News
02/03 16:49
SA Breaking News
05/25 10:44
Business Wire
06/24 17:27
Basic Info
Investment Strategy | |
The investment seeks investment results that correspond generally to the price and yield (before the fund's fees and expenses) of an equity index called the Nasdaq US Smart Food & Beverage IndexTM. The fund will normally invest at least 90% of its net assets (including investment borrowings) in the common stocks and depository receipts that comprise the underlying index. The index is designed to provide exposure to U.S. companies comprising the food and beverage sector that have been selected based upon their liquidity and weighted based upon their cumulative score on three investing factors: volatility, value and growth. The fund is non-diversified. |
General | |
Security Type | Exchange-Traded Fund |
Equity Style | Mid Cap/Blend |
Fixed Income Style | -- |
Broad Asset Class | Sector Equity |
Broad Category | Equity |
Category Name | Consumer Defensive |
Category Index | S&P 1500 Cons Staples TR |
Global Category Name | Consumer Goods & Services Sector Equity |
YCharts Categorization | Consumer Services Equity |
YCharts Benchmark | S&P 1500 Consumer Staples (Sector) Total Return (^SP15CNSSTR) |
Prospectus Objective | Specialty - Unaligned |
Fund Owner Firm Name | First Trust |
Prospectus Benchmark Index | |
Nasdaq US Smart Food&Beverage TR USD | 100.0% |
Broad Asset Class Benchmark Index | |
^MSWNTR | 100.0% |
Manager Tenure | |
Chris Peterson | 6.45 yrs |
Daniel Lindquist | 6.45 yrs |
David McGarel | 6.45 yrs |
Jon Erickson | 6.45 yrs |
Roger Testin | 6.45 yrs |
Stan Ueland | 6.45 yrs |
Erik Russo | 2.16 yrs |
Fundamentals
General | |
Distribution Yield | Upgrade |
Dividend Yield TTM (3-31-23) | 1.42% |
30-Day SEC Yield (2-28-23) | Upgrade |
7-Day SEC Yield | -- |
Number of Holdings | Upgrade |
Stock | |
Weighted Average PE Ratio | 20.45 |
Weighted Average Price to Sales Ratio | Upgrade |
Weighted Average Price to Book Ratio | Upgrade |
Weighted Median ROE | Upgrade |
Weighted Median ROA | Upgrade |
Forecasted Dividend Yield | Upgrade |
Forecasted PE Ratio | Upgrade |
Forecasted Price to Sales Ratio | Upgrade |
Forecasted Price to Book Ratio | Upgrade |
As of March 29, 2023
Fund Details
Key Dates | |
Inception Date | 9/20/2016 |
Last Annual Report Date | 3/31/2022 |
Last Prospectus Date | 8/1/2022 |
Attributes | |
Index Fund |
|
Inverse Fund | No |
Leveraged Fund | No |
Fund of Funds | No |
Currency Hedged Fund | No |
Synthetic Replication Fund | No |
Has Dividend Investment Plan | No |
Socially Responsible Fund | No |
News
Headline
Wire
Time (ET)
SA Breaking News
02/10 16:27
SA Breaking News
02/03 16:49
SA Breaking News
05/25 10:44
Business Wire
06/24 17:27