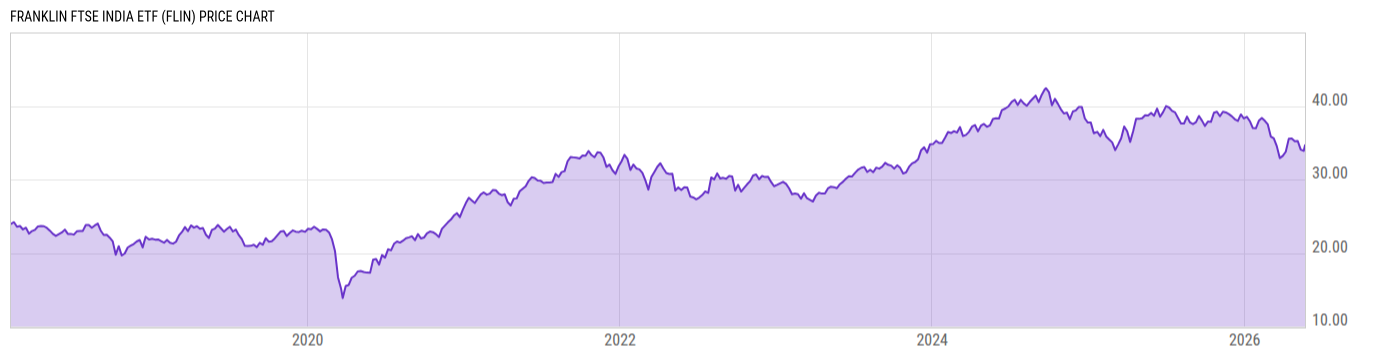
Franklin FTSE India ETF (FLIN)
30.51
+0.01 (+0.02%)
USD |
NYSEARCA |
Aug 15, 16:00
30.52
+0.01 (+0.02%)
After-Hours: 20:00
Price Chart
Key Stats
Customize
Expense Ratio | Discount or Premium to NAV | Total Assets Under Management | 30-Day Average Daily Volume |
---|---|---|---|
0.19% | 1.01% | 55.90M | 6765.90 |
Dividend Yield | Turnover Ratio | 1 Year Fund Level Flows | Max Drawdown (All) |
2.36% | 10.73% | 28.64M | Upgrade |
Basic Info
Investment Strategy | |
The investment seeks to provide investment results that closely correspond, before fees and expenses, to the performance of the FTSE India RIC Capped Index (the FTSE India Capped Index). Under normal market conditions, the fund invests at least 80% of its assets in the component securities of the FTSE India Capped Index and in depositary receipts representing such securities. The FTSE India Capped Index is based on the FTSE India Index and is designed to measure the performance of Indian large- and mid-capitalization stocks. The fund is non-diversified. |
General | |
Security Type | Exchange-Traded Fund |
Equity Style | Large Cap/Blend |
Fixed Income Style | -- |
Broad Asset Class | International Equity |
Broad Category | Equity |
Category Name | India Equity |
Category Index | MSCI India NR USD |
Prospectus Objective | Foreign Stock |
Fund Owner Firm Name | Franklin Templeton Investments |
Prospectus Benchmark Index | |
FTSE India RIC Capped NR USD | 100.0% |
Broad Asset Class Benchmark Index | |
^MSACXUSNTR | 100.0% |
Manager Tenure | |
Dina Ting | 4.48 yrs |
Hailey Harris | 2.67 yrs |
Basit Amin | 0.00 yrs |
Joe Diederich | 0.00 yrs |
Net Fund Flows Versus Category
1 Month
% Rank:
--
--
Category Low
--
Category High
1 Year
% Rank:
5
28.64M
-1.568B
Category Low
28.64M
Category High
3 Months
% Rank:
--
--
Category Low
--
Category High
3 Years
% Rank:
--
--
Category Low
--
Category High
6 Months
% Rank:
--
--
Category Low
--
Category High
5 Years
% Rank:
--
--
Category Low
--
Category High
YTD
% Rank:
--
--
Category Low
--
Category High
10 Years
% Rank:
--
--
Category Low
--
Category High
As of July 31, 2022
Performance Versus Category
As of August 15, 2022. Returns for periods of 1 year and above are annualized.
Annual Total Returns Versus Peers
As of August 15, 2022.
Asset Allocation
Top 10 Holdings
Name | % Weight | Price | % Change |
---|---|---|---|
Reliance Industries Ltd
|
10.54% | -- | -- |
Infosys Ltd
|
6.74% | -- | -- |
Housing Development Finance Corp Ltd
|
5.13% | -- | -- |
Tata Consultancy Services Ltd
|
4.13% | -- | -- |
Hindustan Unilever Ltd
|
2.74% | -- | -- |
Axis Bank Ltd
|
2.06% | -- | -- |
Bajaj Finance Ltd
|
2.05% | -- | -- |
Bharti Airtel Ltd
|
1.93% | -- | -- |
Asian Paints Ltd
|
1.84% | -- | -- |
ICICI Bank Ltd
|
1.63% | -- | -- |
News
Headline
Wire
Time (ET)
SA Breaking News
08/27 09:43
SA Breaking News
10/21 11:42
Basic Info
Investment Strategy | |
The investment seeks to provide investment results that closely correspond, before fees and expenses, to the performance of the FTSE India RIC Capped Index (the FTSE India Capped Index). Under normal market conditions, the fund invests at least 80% of its assets in the component securities of the FTSE India Capped Index and in depositary receipts representing such securities. The FTSE India Capped Index is based on the FTSE India Index and is designed to measure the performance of Indian large- and mid-capitalization stocks. The fund is non-diversified. |
General | |
Security Type | Exchange-Traded Fund |
Equity Style | Large Cap/Blend |
Fixed Income Style | -- |
Broad Asset Class | International Equity |
Broad Category | Equity |
Category Name | India Equity |
Category Index | MSCI India NR USD |
Prospectus Objective | Foreign Stock |
Fund Owner Firm Name | Franklin Templeton Investments |
Prospectus Benchmark Index | |
FTSE India RIC Capped NR USD | 100.0% |
Broad Asset Class Benchmark Index | |
^MSACXUSNTR | 100.0% |
Manager Tenure | |
Dina Ting | 4.48 yrs |
Hailey Harris | 2.67 yrs |
Basit Amin | 0.00 yrs |
Joe Diederich | 0.00 yrs |
Fundamentals
General | |
Distribution Yield | Upgrade |
Dividend Yield TTM (8-15-22) | 2.36% |
30-Day SEC Yield | -- |
7-Day SEC Yield | -- |
Number of Holdings | Upgrade |
Stock | |
Weighted Average PE Ratio | 20.17 |
Weighted Average Price to Sales Ratio | Upgrade |
Weighted Average Price to Book Ratio | Upgrade |
Weighted Median ROE | Upgrade |
Weighted Median ROA | Upgrade |
Forecasted Dividend Yield | Upgrade |
Forecasted PE Ratio | Upgrade |
Forecasted Price to Sales Ratio | Upgrade |
Forecasted Price to Book Ratio | Upgrade |
As of August 12, 2022
Growth Estimates
Fund Details
Key Dates | |
Inception Date | 2/6/2018 |
Last Annual Report Date | 3/31/2022 |
Last Prospectus Date | 8/1/2022 |
Attributes | |
Enhanced Index Fund | No |
Index Fund |
|
Inverse Fund | No |
Leveraged Fund | No |
Fund of Funds | No |
Currency Hedged Fund | No |
Synthetic Replication Fund | No |
Has Dividend Investment Plan | No |
Socially Responsible Fund | No |
News
Headline
Wire
Time (ET)
SA Breaking News
08/27 09:43
SA Breaking News
10/21 11:42