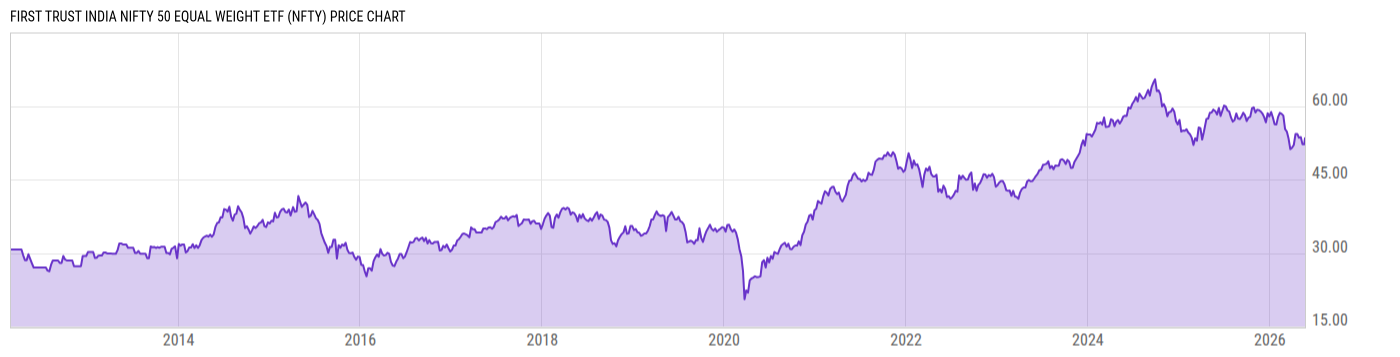
Key Stats

Expense Ratio Discount or Premium to NAV Total Assets Under Management 30-Day Average Daily Volume
0.80% 1.07% 89.04M 5702.60
Dividend Yield Turnover Ratio 1 Year Fund Level Flows Max Drawdown (All)
2.47% 56.00% 39.33M Upgrade

Basic Info

Investment Strategy
The investment seeks investment results that correspond generally to the price and yield (before the fund's fees and expenses) of an equity index called the NIFTY 50 Equal Weight Index. The fund will normally invest at least 90% of its net assets (including investment borrowings) in the common stocks that comprise the index. The index is designed to track the performance of the 50 largest and most liquid Indian securities listed on the National Stock Exchange of India ("NSE") by investing in all of the components of the NIFTY 50.
General
Security Type Exchange-Traded Fund
Equity Style Large Cap/Blend
Fixed Income Style --
Broad Asset Class International Equity
Broad Category Equity
Category Name India Equity
Category Index MSCI India NR USD
Global Category Name India Equity
YCharts Categorization India Equity
YCharts Benchmark MSCI India (^MSIN)
Prospectus Objective Growth
Fund Owner Firm Name First Trust
Prospectus Benchmark Index
NIFTY 50 Equal Weight Index USD 100.0%
Broad Asset Class Benchmark Index
^MSACXUSNTR 100.0%
Manager Tenure
Daniel Lindquist 11.05 yrs
David McGarel 11.05 yrs
Jon Erickson 11.05 yrs
Roger Testin 11.05 yrs
Stan Ueland 11.05 yrs
Chris Peterson 6.96 yrs
Erik Russo 2.16 yrs

Net Fund Flows Versus Category

View Net Fund Flows. Upgrade now.
1M
3M
6M
YTD
1Y
3Y
5Y
10Y
 
80.00B
60.00B
40.00B
20.00B
0
-20.00B
1 Month
% Rank: --
-- Category Low
-- Category High
1 Year
% Rank: 9
39.33M
-493.31M Category Low
55.84M Category High
3 Months
% Rank: --
-- Category Low
-- Category High
3 Years
% Rank: --
-- Category Low
-- Category High
6 Months
% Rank: --
-- Category Low
-- Category High
5 Years
% Rank: --
-- Category Low
-- Category High
YTD
% Rank: --
-- Category Low
-- Category High
10 Years
% Rank: --
-- Category Low
-- Category High
As of February 28, 2023

Performance Versus Category

 
20%
15%
10%
5%
0
View Category Returns. Upgrade now.
Name
1M
3M
YTD
1Y
3Y
5Y
10Y
15Y
Total Return (Price)
--
--
--
--
--
--
--
--
Total Return (NAV)
--
--
--
--
--
--
--
--
Category Rtn. (NAV)
--
--
--
--
--
--
--
--
% Rank in Cat (NAV)
--
--
--
--
--
--
--
--
As of March 30, 2023. Returns for periods of 1 year and above are annualized.

Annual Total Returns Versus Peers

Loading chart...
Name
2016
2017
2018
2019
2020
2021
2022
YTD
11.18%
21.71%
-1.51%
0.57%
10.02%
26.82%
-3.44%
-4.05%
4.50%
27.19%
-14.20%
21.51%
10.65%
7.82%
-16.00%
6.40%
-0.06%
38.51%
-7.55%
4.85%
18.54%
23.72%
-9.46%
-3.80%
-4.49%
66.53%
-37.41%
-21.59%
-0.29%
29.58%
-21.46%
-4.10%
--
--
--
4.76%
14.56%
25.00%
-7.96%
-5.89%
-1.52%
29.19%
-16.65%
25.18%
22.04%
14.32%
-12.06%
2.94%
As of March 30, 2023.

Fundamentals

General
Distribution Yield Upgrade
Dividend Yield TTM (3-31-23) 2.47%
30-Day SEC Yield (2-28-23) Upgrade
7-Day SEC Yield --
Number of Holdings Upgrade
Stock
Weighted Average PE Ratio 17.57
Weighted Average Price to Sales Ratio Upgrade
Weighted Average Price to Book Ratio Upgrade
Weighted Median ROE --
Weighted Median ROA --
Forecasted Dividend Yield Upgrade
Forecasted PE Ratio Upgrade
Forecasted Price to Sales Ratio Upgrade
Forecasted Price to Book Ratio Upgrade
As of March 29, 2023

Growth Estimates

Forecasted 5 Yr Earnings Growth Upgrade
Forecasted Book Value Growth Upgrade
Forecasted Cash Flow Growth Upgrade
Forecasted Earnings Growth Upgrade
Forecasted Revenue Growth Upgrade
As of March 29, 2023

Asset Allocation

As of March 29, 2023.
Type % Net % Long % Short
Cash 0.19% Upgrade Upgrade
Stock 99.81% Upgrade Upgrade
Bond 0.00% Upgrade Upgrade
Convertible 0.00% Upgrade Upgrade
Preferred 0.00% Upgrade Upgrade
Other 0.00% Upgrade Upgrade

Top 10 Holdings

Name % Weight Price % Change
ITC Ltd
2.44% -- --
Bajaj Auto Ltd
2.30% -- --
Dr Reddy's Laboratories Ltd
2.28% -- --
Tech Mahindra Ltd
2.28% -- --
UltraTech Cement Ltd
2.26% -- --
NTPC Ltd
2.24% -- --
Power Grid Corp Of India Ltd
2.22% -- --
Bharat Petroleum Corp Ltd
2.22% -- --
Tata Motors Ltd
2.21% -- --
Oil & Natural Gas Corp Ltd
2.19% -- --

Basic Info

Investment Strategy
The investment seeks investment results that correspond generally to the price and yield (before the fund's fees and expenses) of an equity index called the NIFTY 50 Equal Weight Index. The fund will normally invest at least 90% of its net assets (including investment borrowings) in the common stocks that comprise the index. The index is designed to track the performance of the 50 largest and most liquid Indian securities listed on the National Stock Exchange of India ("NSE") by investing in all of the components of the NIFTY 50.
General
Security Type Exchange-Traded Fund
Equity Style Large Cap/Blend
Fixed Income Style --
Broad Asset Class International Equity
Broad Category Equity
Category Name India Equity
Category Index MSCI India NR USD
Global Category Name India Equity
YCharts Categorization India Equity
YCharts Benchmark MSCI India (^MSIN)
Prospectus Objective Growth
Fund Owner Firm Name First Trust
Prospectus Benchmark Index
NIFTY 50 Equal Weight Index USD 100.0%
Broad Asset Class Benchmark Index
^MSACXUSNTR 100.0%
Manager Tenure
Daniel Lindquist 11.05 yrs
David McGarel 11.05 yrs
Jon Erickson 11.05 yrs
Roger Testin 11.05 yrs
Stan Ueland 11.05 yrs
Chris Peterson 6.96 yrs
Erik Russo 2.16 yrs

Fundamentals

General
Distribution Yield Upgrade
Dividend Yield TTM (3-31-23) 2.47%
30-Day SEC Yield (2-28-23) Upgrade
7-Day SEC Yield --
Number of Holdings Upgrade
Stock
Weighted Average PE Ratio 17.57
Weighted Average Price to Sales Ratio Upgrade
Weighted Average Price to Book Ratio Upgrade
Weighted Median ROE --
Weighted Median ROA --
Forecasted Dividend Yield Upgrade
Forecasted PE Ratio Upgrade
Forecasted Price to Sales Ratio Upgrade
Forecasted Price to Book Ratio Upgrade
As of March 29, 2023

Growth Estimates

Forecasted 5 Yr Earnings Growth Upgrade
Forecasted Book Value Growth Upgrade
Forecasted Cash Flow Growth Upgrade
Forecasted Earnings Growth Upgrade
Forecasted Revenue Growth Upgrade
As of March 29, 2023

Fund Details

Key Dates
Inception Date 2/14/2012
Last Annual Report Date 12/31/2022
Last Prospectus Date 5/2/2022
Attributes
Index Fund Yes
Inverse Fund No
Leveraged Fund No
Fund of Funds No
Currency Hedged Fund No
Synthetic Replication Fund No
Has Dividend Investment Plan No
Socially Responsible Fund No

Top Portfolio Holders

0 of 0