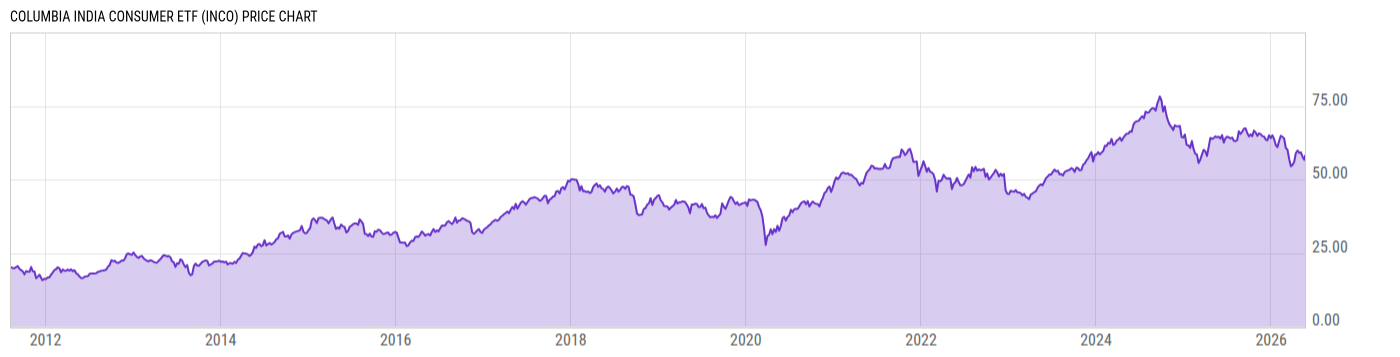
Columbia India Consumer ETF (INCO)
44.11
+0.30
(+0.68%)
USD |
NYSEARCA |
Mar 20, 16:00
44.10
-0.01
(-0.02%)
After-Hours: 20:00
Key Stats
Expense Ratio | Discount or Premium to NAV | Total Assets Under Management | 30-Day Average Daily Volume |
---|---|---|---|
0.75% | -0.36% | 70.36M | 3488.70 |
Dividend Yield | Turnover Ratio | 1 Year Fund Level Flows | Max Drawdown (All) |
0.25% | 31.00% | -9.858M | Upgrade |
Basic Info
Investment Strategy | |
The investment seeks investment results that correspond to the price and yield performance of the Indxx India Consumer Index. The fund will invest at least 80% of its net assets in Indian consumer companies included in the index and the advisor generally expects to be substantially invested at such times, with at least 95% of its net assets invested in these securities. The index is a maximum 30-stock free-float adjusted market capitalization-weighted index designed to measure the market performance of companies in the consumer industry in India, as defined by Indxx's proprietary methodology. It is non-diversified. |
General | |
Security Type | Exchange-Traded Fund |
Equity Style | Large Cap/Growth |
Fixed Income Style | -- |
Broad Asset Class | International Equity |
Broad Category | Equity |
Category Name | India Equity |
Category Index | MSCI India NR USD |
Global Category Name | India Equity |
YCharts Categorization | India Equity |
YCharts Benchmark | MSCI India (^MSIN) |
Prospectus Objective | Specialty - Unaligned |
Fund Owner Firm Name | Columbia Threadneedle |
Prospectus Benchmark Index | |
Indxx India Consumer TR USD | 100.0% |
Broad Asset Class Benchmark Index | |
^MSACXUSNTR | 100.0% |
Manager Tenure | |
Christopher Lo | 6.50 yrs |
Henry Hom | 1.41 yrs |
Net Fund Flows Versus Category
1 Month
% Rank:
--
--
Category Low
--
Category High
1 Year
% Rank:
50
-9.858M
-493.31M
Category Low
55.84M
Category High
3 Months
% Rank:
--
--
Category Low
--
Category High
3 Years
% Rank:
--
--
Category Low
--
Category High
6 Months
% Rank:
--
--
Category Low
--
Category High
5 Years
% Rank:
--
--
Category Low
--
Category High
YTD
% Rank:
--
--
Category Low
--
Category High
10 Years
% Rank:
--
--
Category Low
--
Category High
As of February 28, 2023
Risk
Performance Versus Category
As of March 17, 2023. Returns for periods of 1 year and above are annualized.
Annual Total Returns Versus Peers
As of March 17, 2023.
Asset Allocation
Top 10 Holdings
Name | % Weight | Price | % Change |
---|---|---|---|
Britannia Industries Ltd
|
10.98% | -- | -- |
Godrej Consumer Products Ltd
|
10.90% | -- | -- |
Dabur India Ltd
|
9.63% | -- | -- |
Nestle India Ltd
|
8.21% | -- | -- |
Hindustan Unilever Ltd
|
7.97% | -- | -- |
Marico Ltd
|
7.90% | -- | -- |
Colgate-Palmolive (India) Ltd
|
6.45% | -- | -- |
United Spirits Ltd
|
6.11% | -- | -- |
Bharat Forge Ltd
|
5.69% | -- | -- |
Bajaj Auto Ltd
|
4.88% | -- | -- |
News
Headline
Wire
Time (ET)
Basic Info
Investment Strategy | |
The investment seeks investment results that correspond to the price and yield performance of the Indxx India Consumer Index. The fund will invest at least 80% of its net assets in Indian consumer companies included in the index and the advisor generally expects to be substantially invested at such times, with at least 95% of its net assets invested in these securities. The index is a maximum 30-stock free-float adjusted market capitalization-weighted index designed to measure the market performance of companies in the consumer industry in India, as defined by Indxx's proprietary methodology. It is non-diversified. |
General | |
Security Type | Exchange-Traded Fund |
Equity Style | Large Cap/Growth |
Fixed Income Style | -- |
Broad Asset Class | International Equity |
Broad Category | Equity |
Category Name | India Equity |
Category Index | MSCI India NR USD |
Global Category Name | India Equity |
YCharts Categorization | India Equity |
YCharts Benchmark | MSCI India (^MSIN) |
Prospectus Objective | Specialty - Unaligned |
Fund Owner Firm Name | Columbia Threadneedle |
Prospectus Benchmark Index | |
Indxx India Consumer TR USD | 100.0% |
Broad Asset Class Benchmark Index | |
^MSACXUSNTR | 100.0% |
Manager Tenure | |
Christopher Lo | 6.50 yrs |
Henry Hom | 1.41 yrs |
Fundamentals
General | |
Distribution Yield | Upgrade |
Dividend Yield TTM (3-20-23) | 0.25% |
30-Day SEC Yield | -- |
7-Day SEC Yield | -- |
Number of Holdings | Upgrade |
Stock | |
Weighted Average PE Ratio | 48.15 |
Weighted Average Price to Sales Ratio | Upgrade |
Weighted Average Price to Book Ratio | Upgrade |
Weighted Median ROE | -- |
Weighted Median ROA | -- |
Forecasted Dividend Yield | Upgrade |
Forecasted PE Ratio | Upgrade |
Forecasted Price to Sales Ratio | Upgrade |
Forecasted Price to Book Ratio | Upgrade |
As of March 16, 2023
Fund Details
Key Dates | |
Inception Date | 8/10/2011 |
Last Annual Report Date | 3/31/2022 |
Last Prospectus Date | 8/1/2022 |
Attributes | |
Index Fund |
|
Inverse Fund | No |
Leveraged Fund | No |
Fund of Funds | No |
Currency Hedged Fund | No |
Synthetic Replication Fund | No |
Has Dividend Investment Plan | No |
Socially Responsible Fund | No |
News
Headline
Wire
Time (ET)