

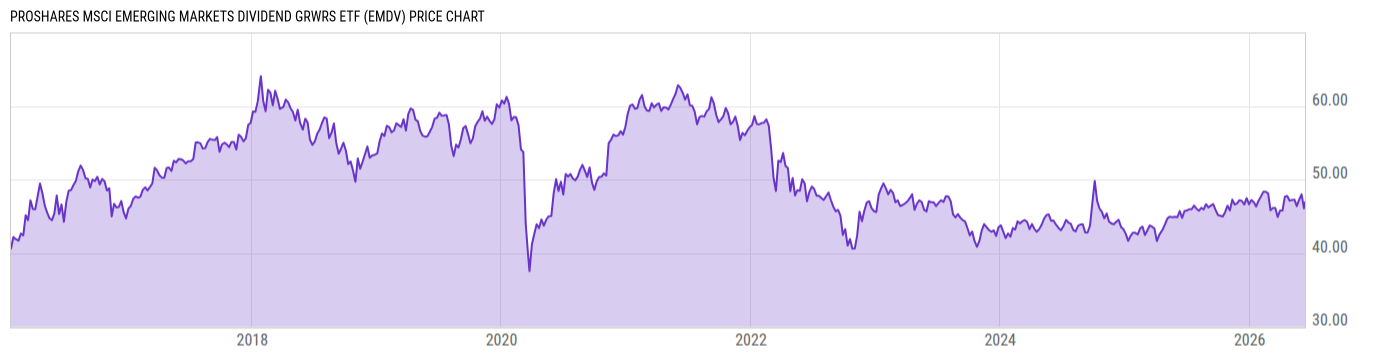
ProShares MSCI Emerging Markets Dividend Grwrs ETF (EMDV)
46.07
-0.11
(-0.24%)
USD |
BATS |
Jun 09, 16:00
Price Chart
Key Stats
| Net Expense Ratio | Discount or Premium to NAV | Total Assets Under Management | 30-Day Average Daily Volume |
|---|---|---|---|
| 0.60% | -1.15% | 7.225M | 144.43 |
| Weighted Average Dividend Yield | Turnover Ratio (Generic) | 1 Year Fund Level Flows | Max Drawdown (Since Inception) |
| 3.32% | 49.00% | -1.095M |
Basic Info
| Investment Strategy | |
| The Fund seeks investment results, before fees and expenses, that track the performance of the MSCI Emerging Markets Dividend Masters Index (the Index). Under normal circumstances, the Fund will invest at least 80% of its total assets in component securities like equity securities and depositary receipts (ADRs & GDRs). |
| General | |
| Security Type | Exchange-Traded Fund |
| Equity Style | Large Cap Core |
| Broad Asset Class | International Equity |
| Broad Category | Equity |
| Global Peer Group | Equity Emerging Markets Global |
| Peer Group | International Equity Income Funds |
| Global Macro | Equity Emerging Markets |
| US Macro | Developed International Markets Funds |
| YCharts Categorization | -- |
| YCharts Benchmark | -- |
| Prospectus Objective | Emerging Markets Funds |
| Fund Owner Firm Name | ProShares |
| Broad Asset Class Benchmark Index | |
| ^MSACXUSNTR | 100.0% |
Performance Versus Peer Group
Annual Total Returns Versus Peers
As of June 10, 2026.
Asset Allocation
As of May 31, 2026.
| Type | % Net |
|---|---|
| Cash | 0.67% |
| Stock | 97.33% |
| Bond | 0.00% |
| Convertible | 0.00% |
| Preferred | 0.00% |
| Other | 2.00% |
Basic Info
| Investment Strategy | |
| The Fund seeks investment results, before fees and expenses, that track the performance of the MSCI Emerging Markets Dividend Masters Index (the Index). Under normal circumstances, the Fund will invest at least 80% of its total assets in component securities like equity securities and depositary receipts (ADRs & GDRs). |
| General | |
| Security Type | Exchange-Traded Fund |
| Equity Style | Large Cap Core |
| Broad Asset Class | International Equity |
| Broad Category | Equity |
| Global Peer Group | Equity Emerging Markets Global |
| Peer Group | International Equity Income Funds |
| Global Macro | Equity Emerging Markets |
| US Macro | Developed International Markets Funds |
| YCharts Categorization | -- |
| YCharts Benchmark | -- |
| Prospectus Objective | Emerging Markets Funds |
| Fund Owner Firm Name | ProShares |
| Broad Asset Class Benchmark Index | |
| ^MSACXUSNTR | 100.0% |