

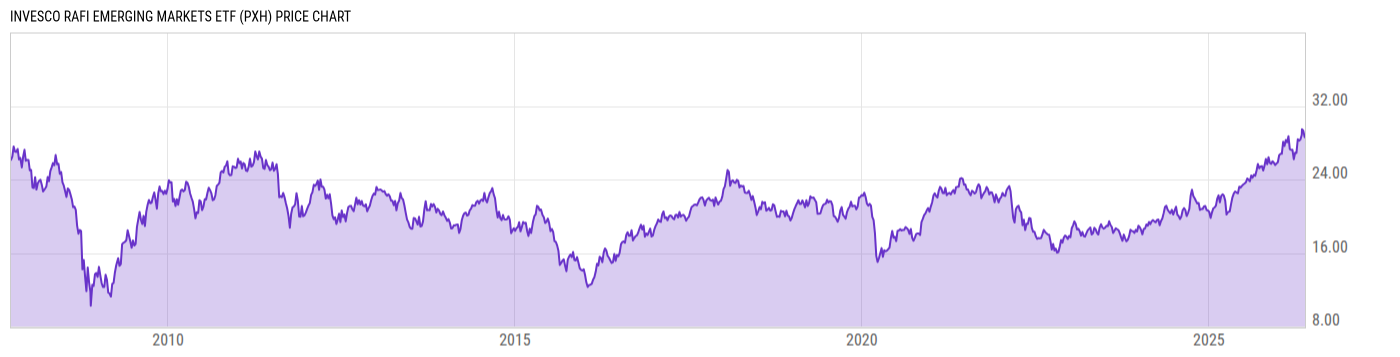
Invesco RAFI Emerging Markets ETF (PXH)
28.44
+0.11
(+0.39%)
USD |
NYSEARCA |
Jun 08, 16:00
28.44
0.00 (0.00%)
After-Hours: 20:00
Price Chart
Key Stats
| Net Expense Ratio | Discount or Premium to NAV | Total Assets Under Management | 30-Day Average Daily Volume |
|---|---|---|---|
| 0.47% | -0.98% | 1.958B | 236830.0 |
| Weighted Average Dividend Yield | Turnover Ratio (Generic) | 1 Year Fund Level Flows | Max Drawdown (Since Inception) |
| 3.50% | 27.00% | 50.99M |
Basic Info
| Investment Strategy | |
| The Fund seeks to track the investment results of the RAFI Fundamental Select Emerging Markets 350 Index. The Fund will generally invest in securities that comprise the Underlying Index which is comprised of approximately 350 common stocks and is designed to track the performance of the largest emerging markets companies. |
| General | |
| Security Type | Exchange-Traded Fund |
| Equity Style | Large Cap Value |
| Broad Asset Class | International Equity |
| Broad Category | Equity |
| Global Peer Group | Equity Emerging Markets Global |
| Peer Group | Emerging Markets Funds |
| Global Macro | Equity Emerging Markets |
| US Macro | Emerging Markets Equity Funds |
| YCharts Categorization | -- |
| YCharts Benchmark | -- |
| Prospectus Objective | Emerging Markets Funds |
| Fund Owner Firm Name | Invesco |
| Broad Asset Class Benchmark Index | |
| ^MSACXUSNTR | 100.0% |
Performance Versus Peer Group
Annual Total Returns Versus Peers
As of June 08, 2026.
Asset Allocation
As of April 30, 2026.
| Type | % Net |
|---|---|
| Cash | 0.01% |
| Stock | 90.94% |
| Bond | 0.21% |
| Convertible | 0.00% |
| Preferred | 7.61% |
| Other | 1.23% |
Basic Info
| Investment Strategy | |
| The Fund seeks to track the investment results of the RAFI Fundamental Select Emerging Markets 350 Index. The Fund will generally invest in securities that comprise the Underlying Index which is comprised of approximately 350 common stocks and is designed to track the performance of the largest emerging markets companies. |
| General | |
| Security Type | Exchange-Traded Fund |
| Equity Style | Large Cap Value |
| Broad Asset Class | International Equity |
| Broad Category | Equity |
| Global Peer Group | Equity Emerging Markets Global |
| Peer Group | Emerging Markets Funds |
| Global Macro | Equity Emerging Markets |
| US Macro | Emerging Markets Equity Funds |
| YCharts Categorization | -- |
| YCharts Benchmark | -- |
| Prospectus Objective | Emerging Markets Funds |
| Fund Owner Firm Name | Invesco |
| Broad Asset Class Benchmark Index | |
| ^MSACXUSNTR | 100.0% |