

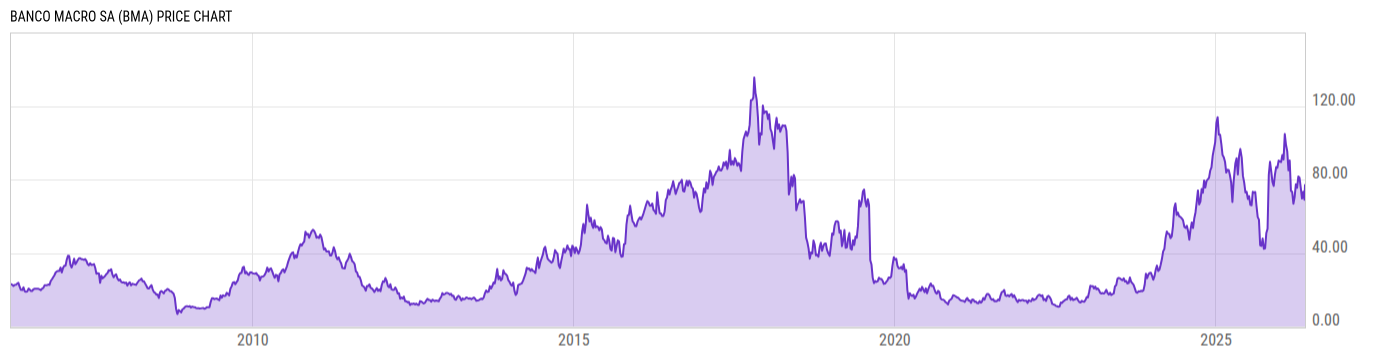
Banco Macro SA (BMA)
87.69
-0.31
(-0.35%)
USD |
NYSE |
Jun 10, 16:00
87.62
-0.07
(-0.08%)
After-Hours: 17:11
Price Chart
Key Stats
| Price and Performance | |
|---|---|
| Market Cap | 5.508B |
| 52 Week High (Daily) | |
| 52 Week Low (Daily) | |
| All-Time High (Daily) | |
| Year to Date Total Returns (Daily) | |
| 1 Month Total Returns (Daily) | |
| 1 Year Total Returns (Daily) | 24.11% |
| Valuation | |
| PE Ratio | 19.79 |
| PE Ratio (Forward) | |
| PS Ratio | 1.130 |
| Price to Book Value | 1.324 |
| EV to EBITDA | |
| Dividend | |
|---|---|
| Dividend | 0.5296 |
| Dividend Yield (Forward) | |
| Financials | |
| Revenue (5 Year Growth) | |
| Revenue (Quarterly YoY Growth) | |
| EPS Diluted (5 Year Growth) | |
| EPS Diluted (Quarterly YoY Growth) | |
| Debt to Equity Ratio | 0.2726 |
| Return on Equity | |
| Return on Assets | |
| Risk | |
| Beta (5Y) | |
| Max Drawdown (5Y) | 91.68% |
Profile
| Banco Macro SA engages in the provision of financial and banking services. It serves the low and mid-income individuals, and small and mid-sized companies. The firm offers savings, checking accounts, time deposits, fund management, loans, mortgages, and direct banking transactions. The company was founded on November 21, 1966 and is headquartered in Buenos Aires, Argentina. |
| URL | http://www.macro.com.ar |
| Investor Relations URL | https://www.macro.com.ar/relaciones-inversores/en/home-page |
| HQ State/Province | Buenos Aires |
| Sector | Financials |
| Industry | Banks |
| Equity Style | Small Cap Core |
| Next Earnings Release | Aug. 26, 2026 (est.) |
| Last Earnings Release | May. 27, 2026 |
| Next Ex-Dividend Date | N/A |
| Last Ex-Dividend Date | Jun. 02, 2026 |