

Wilshire International Equity Fund Investment (WLCTX)
13.49
+0.02
(+0.15%)
USD |
May 22 2026
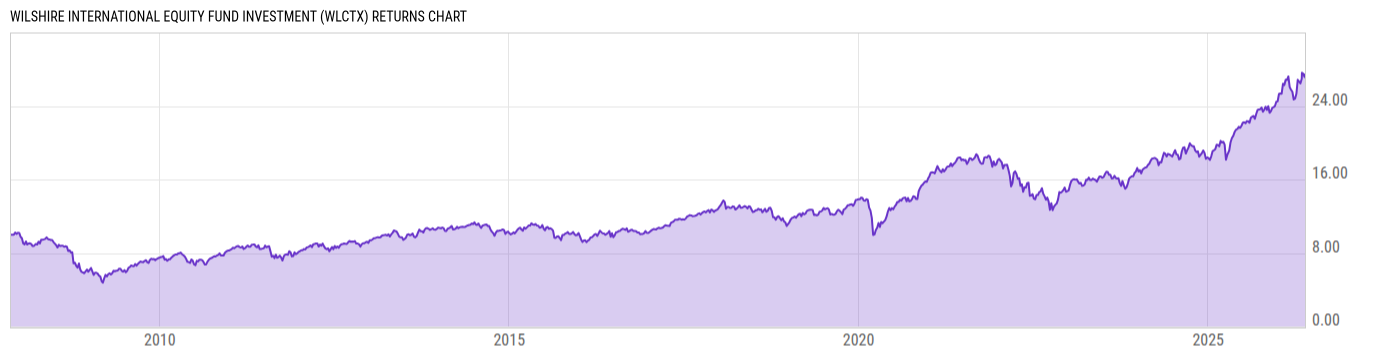
Returns Chart
Key Stats
| Net Expense Ratio | Total Assets Under Management | Weighted Average Dividend Yield | Turnover Ratio (Generic) |
|---|---|---|---|
| 1.50% | 247.34M | 2.52% | 54.00% |
| 1 Year Fund Level Flows | 1 Year Total Returns (Daily) | Annualized Total Returns Since Inception (Daily) | Max Drawdown (Since Inception) |
| -37.05M | 29.66% |
Basic Info
| Investment Strategy | |
| The Fund seeks capital appreciation. The Fund invests, under normal circumstances, at least 80% of its net assets in equity securities. The Fund invests in companies organized outside of the United States. Since the Fund may invest in companies of any size, it may at times invest in small-cap companies. |
| General | |
| Security Type | Mutual Fund |
| Equity Style | Multi Cap Core |
| Broad Asset Class | International Equity |
| Broad Category | Equity |
| Global Peer Group | Equity Global ex US |
| Peer Group | International Multi-Cap Core |
| Global Macro | Equity Global |
| US Macro | Developed International Markets Funds |
| YCharts Categorization | -- |
| YCharts Benchmark | -- |
| Prospectus Objective | International Funds |
| Fund Owner Firm Name | Wilshire |
| Broad Asset Class Benchmark Index | |
| ^MSACXUSNTR | 100.0% |
Net Fund Flows Versus Peer Group
1 Month
% Rank:
50
-481.67M
Peer Group Low
859.48M
Peer Group High
1 Year
% Rank:
58
-37.05M
-2.615B
Peer Group Low
21.51B
Peer Group High
3 Months
% Rank:
54
-1.465B
Peer Group Low
5.508B
Peer Group High
3 Years
% Rank:
59
-7.655B
Peer Group Low
39.91B
Peer Group High
6 Months
% Rank:
53
-1.572B
Peer Group Low
12.45B
Peer Group High
5 Years
% Rank:
56
-14.71B
Peer Group Low
64.58B
Peer Group High
YTD
% Rank:
53
-1.926B
Peer Group Low
7.283B
Peer Group High
10 Years
% Rank:
67
-43.50B
Peer Group Low
118.77B
Peer Group High
Date Unavailable
Risk
Performance Versus Peer Group
Annual Total Returns Versus Peers
As of May 26, 2026.
Asset Allocation
As of March 31, 2026.
| Type | % Net |
|---|---|
| Cash | 6.10% |
| Stock | 80.25% |
| Bond | 11.36% |
| Convertible | 0.00% |
| Preferred | 1.07% |
| Other | 1.22% |
Top 10 Holdings
| Name | % Weight | Price | % Change |
|---|---|---|---|
|
USD Cash
|
6.46% | -- | -- |
| Taiwan Semiconductor Manufacturing Co., Ltd. | 2.89% | 17.24 | 0.00% |
|
Other Assets less Liabilities
|
2.38% | -- | -- |
| Voya VACS Series SC Fund | 2.10% | 10.35 | 0.00% |
| Siemens Energy AG | 1.87% | 209.04 | 3.98% |
| Rolls-Royce Holdings Plc | 1.43% | 16.98 | 2.07% |
| BAE Systems Plc | 1.07% | 26.82 | 0.24% |
| Safran SA | 0.94% | 342.26 | 2.53% |
| Sea Ltd. (Singapore) | 0.90% | 89.27 | 2.29% |
| Samsung Electronics Co., Ltd. | 0.87% | 140.00 | 0.00% |
Fees & Availability
| Fees | |
| Actual 12B-1 Fee | 0.25% |
| Actual Management Fee | 0.74% |
| Administration Fee | 869.0% |
| Maximum Front Load | -- |
| Maximum Deferred Load | -- |
| Maximum Redemption Fee | 1.00% |
| General Availability | |
| Available for Insurance Product | -- |
| Available for RRSP | -- |
| Purchase Details | |
| Open to New Investors |
|
| Minimum Initial Investment | 2500.00 None |
| Minimum Subsequent Investment | 100.00 None |
Basic Info
| Investment Strategy | |
| The Fund seeks capital appreciation. The Fund invests, under normal circumstances, at least 80% of its net assets in equity securities. The Fund invests in companies organized outside of the United States. Since the Fund may invest in companies of any size, it may at times invest in small-cap companies. |
| General | |
| Security Type | Mutual Fund |
| Equity Style | Multi Cap Core |
| Broad Asset Class | International Equity |
| Broad Category | Equity |
| Global Peer Group | Equity Global ex US |
| Peer Group | International Multi-Cap Core |
| Global Macro | Equity Global |
| US Macro | Developed International Markets Funds |
| YCharts Categorization | -- |
| YCharts Benchmark | -- |
| Prospectus Objective | International Funds |
| Fund Owner Firm Name | Wilshire |
| Broad Asset Class Benchmark Index | |
| ^MSACXUSNTR | 100.0% |
Fundamentals
| General | |
| Distribution Yield | -- |
| Dividend Yield TTM (5-21-26) | 2.50% |
| 30-Day SEC Yield | -- |
| 7-Day SEC Yield | -- |
| Number of Holdings | 1039 |
| Stock | |
| Weighted Average PE Ratio | 22.34 |
| Weighted Average Price to Sales Ratio | 3.645 |
| Weighted Average Price to Book Ratio | 4.544 |
| Weighted Median ROE | 29.13% |
| Weighted Median ROA | 8.08% |
| ROI (TTM) | 13.83% |
| Return on Investment (TTM) | 13.83% |
| Earning Yield | 0.0639 |
| LT Debt / Shareholders Equity | 0.5982 |
| Number of Equity Holdings | 810 |
| Bond | |
| Yield to Maturity (3-31-26) | -- |
| Effective Duration | -- |
| Average Coupon | -- |
| Calculated Average Quality | -- |
| Effective Maturity | -- |
| Nominal Maturity | -- |
| Number of Bond Holdings | 180 |
As of March 31, 2026
Growth Metrics
| EPS Growth (1Y) | 28.82% |
| EPS Growth (3Y) | 14.01% |
| EPS Growth (5Y) | 19.67% |
| Sales Growth (1Y) | 9.96% |
| Sales Growth (3Y) | 8.49% |
| Sales Growth (5Y) | 11.63% |
| Sales per Share Growth (1Y) | 10.81% |
| Sales per Share Growth (3Y) | 8.62% |
| Operating Cash Flow - Growth Rate (3Y) | 20.51% |
As of March 31, 2026
Fund Details
| Key Dates | |
| Inception Date | 11/15/2007 |
| Last Annual Report Date | 12/31/2025 |
| Last Prospectus Date | 4/30/2025 |
| Share Classes | |
| WLTTX | Inst |
| Attributes | |
| Index Fund | -- |
| Inverse Fund | -- |
| Leveraged Fund | -- |
| Fund of Funds | No |
| Currency Hedged Fund | -- |
| Socially Responsible Fund | No |
Top Portfolio Holders
| Name | % Weight |
|---|---|
| Portfolio A | 5.00% |
| Portfolio B | 3.50% |
| Portfolio C | 2.25% |
Excel Add-In Codes
| Name: =YCI("M:WLCTX", "name") |
| Broad Asset Class: =YCI("M:WLCTX", "broad_asset_class") |
| Broad Category: =YCI("M:WLCTX", "broad_category_group") |
| Prospectus Objective: =YCI("M:WLCTX", "prospectus_objective") |
| To find the codes for any of our securities and financial metrics, see our Complete Excel Reference. |