

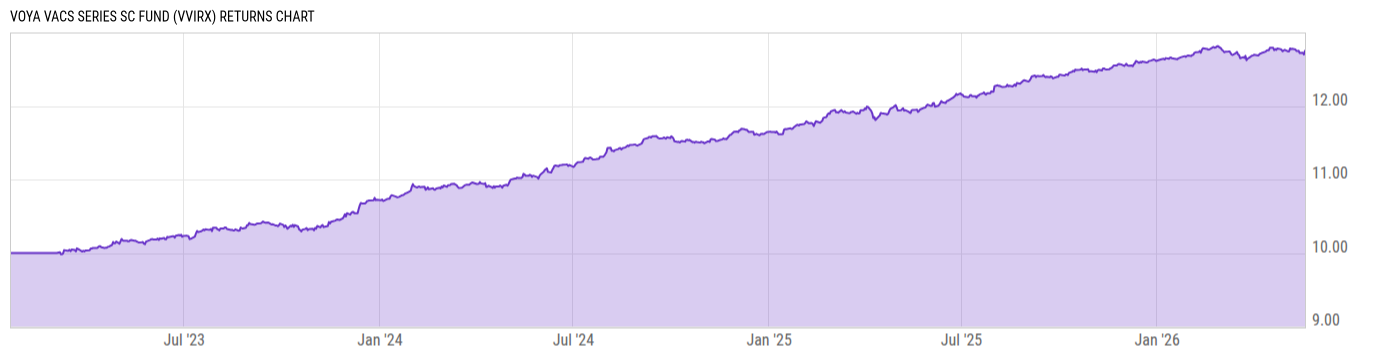
Voya VACS Series SC Fund (VVIRX)
10.34
-0.01
(-0.10%)
USD |
Jun 08 2026
Returns Chart
Key Stats
| Net Expense Ratio | Total Assets Under Management | Weighted Average Dividend Yield | Turnover Ratio (Generic) |
|---|---|---|---|
| 0.05% | 130.33M | -- | 28.00% |
| 1 Year Fund Level Flows | 1 Year Total Returns (Daily) | Annualized Total Returns Since Inception (Daily) | Max Drawdown (Since Inception) |
| -84.20M | 6.49% |
Basic Info
| Investment Strategy | |
| The Fund seeks to maximize total return through a combination of current income and capital appreciation. Under normal market conditions, the Fund invests at least 80% of its net assets in securitized credit securities which include CMBS, ABS, RMBS, and CMOs and may be fixed rate or adjustable-rate securities. |
| General | |
| Security Type | Mutual Fund |
| Equity Style | -- |
| Broad Asset Class | Taxable Bond |
| Broad Category | Fixed Income |
| Global Peer Group | Bond USD Mortgages |
| Peer Group | U.S. Mortgage Funds |
| Global Macro | Bond HC |
| US Macro | U.S. Government & Treasury Fixed Income Funds |
| YCharts Categorization | -- |
| YCharts Benchmark | -- |
| Prospectus Objective | U.S. Mortgage Funds |
| Fund Owner Firm Name | Voya |
| Broad Asset Class Benchmark Index | |
| ^BBUSATR | 100.0% |
Net Fund Flows Versus Peer Group
1 Month
% Rank:
55
-105.93M
Peer Group Low
315.90M
Peer Group High
1 Year
% Rank:
87
-84.20M
-2.129B
Peer Group Low
1.463B
Peer Group High
3 Months
% Rank:
90
-583.12M
Peer Group Low
530.19M
Peer Group High
3 Years
% Rank:
78
-6.769B
Peer Group Low
7.386B
Peer Group High
6 Months
% Rank:
87
-1.037B
Peer Group Low
1.036B
Peer Group High
5 Years
% Rank:
46
-18.17B
Peer Group Low
10.59B
Peer Group High
YTD
% Rank:
93
-615.00M
Peer Group Low
724.64M
Peer Group High
10 Years
% Rank:
50
-35.90B
Peer Group Low
25.97B
Peer Group High
Date Unavailable
Risk
Performance Versus Peer Group
Annual Total Returns Versus Peers
As of June 09, 2026.
Asset Allocation
As of April 30, 2026.
| Type | % Net |
|---|---|
| Cash | -19.05% |
| Stock | 0.00% |
| Bond | 92.95% |
| Convertible | 0.00% |
| Preferred | 0.00% |
| Other | 26.10% |
Top 10 Holdings
| Name | % Weight | Price | % Change |
|---|---|---|---|
|
2YR T-NOTE JUN26
|
13.73% | -- | -- |
|
5YR T NOTE JUN26
|
10.47% | -- | -- |
|
10YR UL TN JUN26
|
3.74% | -- | -- |
|
PRIMA CAPITAL CRE SECURITIZATION LTD 197 D SEQ FIX 4.25% 27-DEC-2050
|
2.24% | -- | -- |
|
US T BONDS JUN26
|
1.74% | -- | -- |
|
GAM RE-REMIC TRUST 21FRR1 1C 27-JUN-2050
|
1.61% | -- | -- |
| Mondelez International, Inc. MONDINT 05/04/2026 FIX USD Corporate (Matured) | 1.54% | 99.97 | 0.01% |
| ENBRIDGE (U.S.) INC. ENBRUS 05/07/2026 FIX USD Corporate (Matured) | 1.54% | 99.99 | 0.02% |
|
RFM RE-REMIC TRUST 22FRR1 60 VAR 2.31% 27-NOV-2026
|
1.51% | -- | -- |
|
TRAFIGURA SECURITISATION FINANCE PLC 241 A2 FIX 5.98% 15-NOV-2027
|
1.43% | -- | -- |
Fees & Availability
| Fees | |
| Actual 12B-1 Fee | -- |
| Actual Management Fee | -- |
| Administration Fee | -- |
| Maximum Front Load | -- |
| Maximum Deferred Load | -- |
| Maximum Redemption Fee | -- |
| General Availability | |
| Available for Insurance Product | No |
| Available for RRSP | No |
| Purchase Details | |
| Open to New Investors |
|
| Minimum Initial Investment | 0.00 None |
| Minimum Subsequent Investment | 0.00 None |
Basic Info
| Investment Strategy | |
| The Fund seeks to maximize total return through a combination of current income and capital appreciation. Under normal market conditions, the Fund invests at least 80% of its net assets in securitized credit securities which include CMBS, ABS, RMBS, and CMOs and may be fixed rate or adjustable-rate securities. |
| General | |
| Security Type | Mutual Fund |
| Equity Style | -- |
| Broad Asset Class | Taxable Bond |
| Broad Category | Fixed Income |
| Global Peer Group | Bond USD Mortgages |
| Peer Group | U.S. Mortgage Funds |
| Global Macro | Bond HC |
| US Macro | U.S. Government & Treasury Fixed Income Funds |
| YCharts Categorization | -- |
| YCharts Benchmark | -- |
| Prospectus Objective | U.S. Mortgage Funds |
| Fund Owner Firm Name | Voya |
| Broad Asset Class Benchmark Index | |
| ^BBUSATR | 100.0% |
Fundamentals
| General | |
| Distribution Yield | -- |
| Dividend Yield TTM (6-5-26) | 6.90% |
| 30-Day SEC Yield (5-31-26) | 5.96% |
| 7-Day SEC Yield | -- |
| Number of Holdings | 10 |
| Bond | |
| Yield to Maturity (4-30-26) | 5.91% |
| Effective Duration | -- |
| Average Coupon | 4.66% |
| Calculated Average Quality | 2.238 |
| Effective Maturity | 20.18 |
| Nominal Maturity | 20.18 |
| Number of Bond Holdings | 4 |
As of April 30, 2026
Fund Details
| Key Dates | |
| Inception Date | 3/3/2023 |
| Last Annual Report Date | 3/31/2025 |
| Last Prospectus Date | -- |
| Attributes | |
| Index Fund | -- |
| Inverse Fund | No |
| Leveraged Fund | -- |
| Fund of Funds | No |
| Currency Hedged Fund | -- |
| Socially Responsible Fund | No |
Top Portfolio Holders
| Name | % Weight |
|---|---|
| Portfolio A | 5.00% |
| Portfolio B | 3.50% |
| Portfolio C | 2.25% |
Excel Add-In Codes
| Name: =YCI("M:VVIRX", "name") |
| Broad Asset Class: =YCI("M:VVIRX", "broad_asset_class") |
| Broad Category: =YCI("M:VVIRX", "broad_category_group") |
| Prospectus Objective: =YCI("M:VVIRX", "prospectus_objective") |
| To find the codes for any of our securities and financial metrics, see our Complete Excel Reference. |