

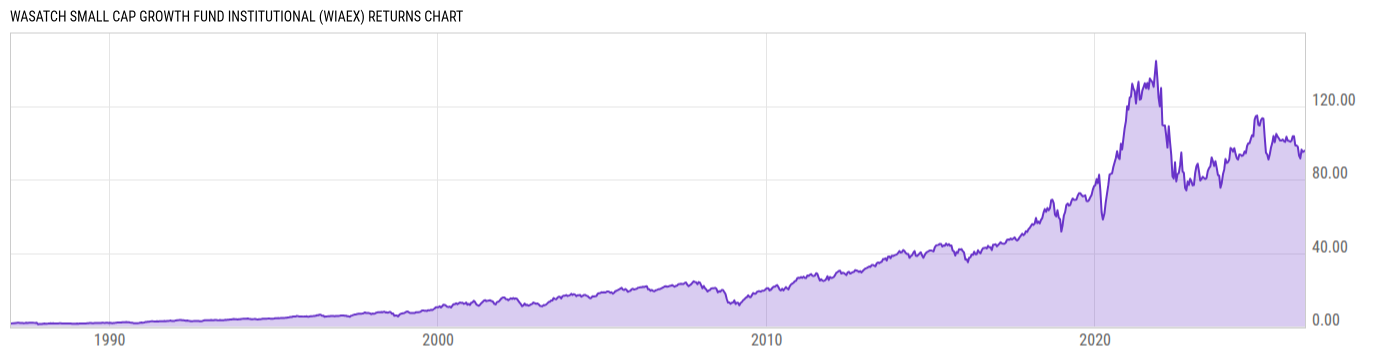
Wasatch Small Cap Growth Fund Institutional (WIAEX)
37.24
+0.40
(+1.09%)
USD |
Jun 09 2026
Returns Chart
Key Stats
| Net Expense Ratio | Total Assets Under Management | Weighted Average Dividend Yield | Turnover Ratio (Generic) |
|---|---|---|---|
| 1.05% | 1.129B | 0.10% | 39.00% |
| 1 Year Fund Level Flows | 1 Year Total Returns (Daily) | Annualized Total Returns Since Inception (Daily) | Max Drawdown (Since Inception) |
| -672.25M | -6.72% |
Basic Info
| Investment Strategy | |
| The Fund seeks long term growth of capital. Income is a secondary objective. The Fund invests primarily in small growth companies. Under normal market conditions, we will invest at least 80% of the Funds net assets in the equity securities, typically common stock, of small-capitalization companies. |
| General | |
| Security Type | Mutual Fund |
| Equity Style | Small Cap Growth |
| Broad Asset Class | US Equity |
| Broad Category | Equity |
| Global Peer Group | Equity US Sm&Mid Cap |
| Peer Group | Small-Cap Growth Funds |
| Global Macro | Equity North America |
| US Macro | Small-Cap Funds |
| YCharts Categorization | -- |
| YCharts Benchmark | -- |
| Prospectus Objective | Small-Cap Funds |
| Fund Owner Firm Name | Wasatch |
| Broad Asset Class Benchmark Index | |
| ^SPXTR | 100.0% |
Net Fund Flows Versus Peer Group
1 Month
% Rank:
95
-228.22M
Peer Group Low
324.86M
Peer Group High
1 Year
% Rank:
90
-672.25M
-2.473B
Peer Group Low
2.782B
Peer Group High
3 Months
% Rank:
92
-1.034B
Peer Group Low
1.725B
Peer Group High
3 Years
% Rank:
87
-5.902B
Peer Group Low
4.129B
Peer Group High
6 Months
% Rank:
88
-1.528B
Peer Group Low
3.434B
Peer Group High
5 Years
% Rank:
81
-6.533B
Peer Group Low
4.316B
Peer Group High
YTD
% Rank:
89
-1.107B
Peer Group Low
2.683B
Peer Group High
10 Years
% Rank:
87
-12.26B
Peer Group Low
4.826B
Peer Group High
Date Unavailable
Risk
Performance Versus Peer Group
Annual Total Returns Versus Peers
As of June 10, 2026.
Asset Allocation
As of March 31, 2026.
| Type | % Net |
|---|---|
| Cash | 0.67% |
| Stock | 98.88% |
| Bond | 0.00% |
| Convertible | 0.00% |
| Preferred | 0.00% |
| Other | 0.45% |
Top 10 Holdings
| Name | % Weight | Price | % Change |
|---|---|---|---|
| HealthEquity, Inc. | 4.77% | 89.27 | 0.04% |
| RBC Bearings, Inc. | 4.35% | 576.20 | -2.74% |
| The Ensign Group, Inc. | 4.32% | 150.34 | -3.16% |
| SiteOne Landscape Supply, Inc. | 4.26% | 104.67 | -2.49% |
| Medpace Holdings, Inc. | 3.59% | 467.32 | 0.11% |
| Camtek Ltd. | 3.34% | 166.61 | -0.92% |
| Fabrinet | 3.31% | 572.16 | -2.36% |
| PJT Partners, Inc. | 3.28% | 157.79 | -2.60% |
| Nova Ltd. | 3.17% | 509.57 | -0.96% |
| Everus Construction Group, Inc. | 3.11% | 135.63 | -7.47% |
Fees & Availability
| Fees | |
| Actual 12B-1 Fee | -- |
| Actual Management Fee | 0.99% |
| Administration Fee | 120.1K% |
| Maximum Front Load | -- |
| Maximum Deferred Load | -- |
| Maximum Redemption Fee | 2.00% |
| General Availability | |
| Available for Insurance Product | No |
| Available for RRSP | No |
| Purchase Details | |
| Open to New Investors |
|
| Minimum Initial Investment | 100000.0 None |
| Minimum Subsequent Investment | 5000.00 None |
Basic Info
| Investment Strategy | |
| The Fund seeks long term growth of capital. Income is a secondary objective. The Fund invests primarily in small growth companies. Under normal market conditions, we will invest at least 80% of the Funds net assets in the equity securities, typically common stock, of small-capitalization companies. |
| General | |
| Security Type | Mutual Fund |
| Equity Style | Small Cap Growth |
| Broad Asset Class | US Equity |
| Broad Category | Equity |
| Global Peer Group | Equity US Sm&Mid Cap |
| Peer Group | Small-Cap Growth Funds |
| Global Macro | Equity North America |
| US Macro | Small-Cap Funds |
| YCharts Categorization | -- |
| YCharts Benchmark | -- |
| Prospectus Objective | Small-Cap Funds |
| Fund Owner Firm Name | Wasatch |
| Broad Asset Class Benchmark Index | |
| ^SPXTR | 100.0% |
Fundamentals
| General | |
| Distribution Yield | -- |
| Dividend Yield TTM (6-8-26) | 0.00% |
| 30-Day SEC Yield | -- |
| 7-Day SEC Yield | -- |
| Number of Holdings | 45 |
| Stock | |
| Weighted Average PE Ratio | 40.83 |
| Weighted Average Price to Sales Ratio | 4.960 |
| Weighted Average Price to Book Ratio | 7.118 |
| Weighted Median ROE | 14.54% |
| Weighted Median ROA | 6.95% |
| ROI (TTM) | 8.49% |
| Return on Investment (TTM) | 8.49% |
| Earning Yield | 0.0285 |
| LT Debt / Shareholders Equity | 0.5474 |
| Number of Equity Holdings | 43 |
As of March 31, 2026
Growth Metrics
| EPS Growth (1Y) | 24.95% |
| EPS Growth (3Y) | 24.53% |
| EPS Growth (5Y) | 25.09% |
| Sales Growth (1Y) | 21.51% |
| Sales Growth (3Y) | 19.34% |
| Sales Growth (5Y) | 21.38% |
| Sales per Share Growth (1Y) | 24.97% |
| Sales per Share Growth (3Y) | 16.72% |
| Operating Cash Flow - Growth Rate (3Y) | 42.09% |
As of March 31, 2026
Fund Details
| Key Dates | |
| Inception Date | 2/1/2016 |
| Last Annual Report Date | 9/30/2025 |
| Last Prospectus Date | 1/31/2026 |
| Share Classes | |
| WAAEX | Inv |
| Attributes | |
| Index Fund | -- |
| Inverse Fund | No |
| Leveraged Fund | -- |
| Fund of Funds | No |
| Currency Hedged Fund | -- |
| Socially Responsible Fund | No |
Top Portfolio Holders
| Name | % Weight |
|---|---|
| Portfolio A | 5.00% |
| Portfolio B | 3.50% |
| Portfolio C | 2.25% |
Excel Add-In Codes
| Name: =YCI("M:WIAEX", "name") |
| Broad Asset Class: =YCI("M:WIAEX", "broad_asset_class") |
| Broad Category: =YCI("M:WIAEX", "broad_category_group") |
| Prospectus Objective: =YCI("M:WIAEX", "prospectus_objective") |
| To find the codes for any of our securities and financial metrics, see our Complete Excel Reference. |