

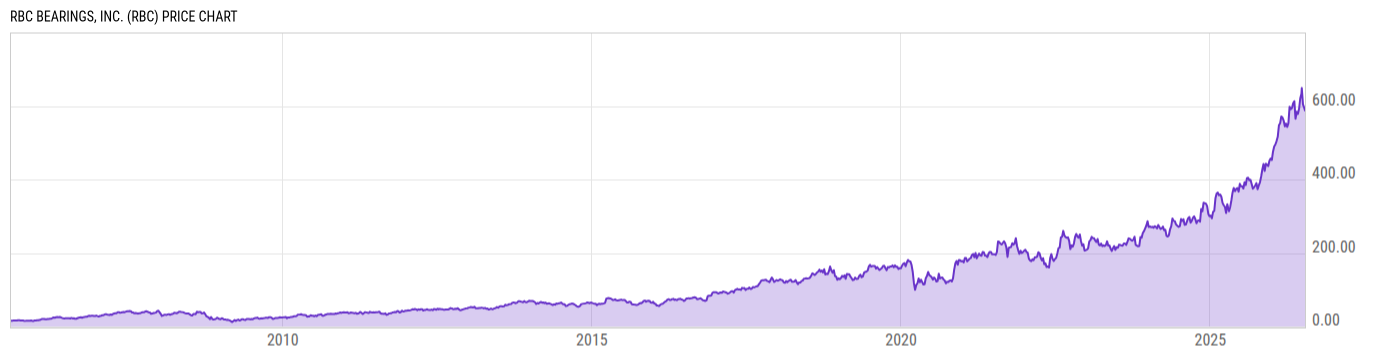
RBC Bearings, Inc. (RBC)
587.73
+3.14
(+0.54%)
USD |
NYSE |
Jul 14, 16:00
587.73
0.00 (0.00%)
After-Hours: 20:00
Price Chart
Key Stats
| Price and Performance | |
|---|---|
| Market Cap | 18.59B |
| 52 Week High (Daily) | |
| 52 Week Low (Daily) | |
| All-Time High (Daily) | |
| Year to Date Total Returns (Daily) | |
| 1 Month Total Returns (Daily) | |
| 1 Year Total Returns (Daily) | 54.56% |
| Valuation | |
| PE Ratio | 64.65 |
| PE Ratio (Forward) | |
| PS Ratio | 9.937 |
| Price to Book Value | 5.532 |
| EV to EBITDA | |
| Dividend | |
|---|---|
| Dividend | -- |
| Dividend Yield (Forward) | |
| Financials | |
| Revenue (5 Year Growth) | |
| Revenue (Quarterly YoY Growth) | |
| EPS Diluted (5 Year Growth) | |
| EPS Diluted (Quarterly YoY Growth) | |
| Debt to Equity Ratio | 0.295 |
| Return on Equity | |
| Return on Assets | |
| Risk | |
| Beta (5Y) | |
| Max Drawdown (5Y) | 35.47% |
Profile
| RBC Bearings, Inc. engages in the provision of design, manufacture, and marketing of engineered precision bearings and products. It operates through the Aerospace and Defense, and Industrial segments. The Aerospace and Defense segment represents the end markets for the company’s highly engineered bearings and precision components used in commercial aerospace, defense aerospace, and sea and ground defense applications. The Industrial segment refers to the end markets for the company’s highly engineered bearings, gearings and precision components used in various industrial applications including power transmission, construction, mining, energy and specialized equipment manufacturing, semiconductor production equipment manufacturing, agricultural machinery, commercial truck and automotive manufacturing, and tool holding. The company was founded in 1919 and is headquartered in Oxford, CT. |
| URL | http://www.rbcbearings.com |
| Investor Relations URL | https://investor.rbcbearings.com/ |
| HQ State/Province | Connecticut |
| Sector | Industrials |
| Industry | Machinery |
| Equity Style | Small Cap Growth |
| Next Earnings Release | Jul. 31, 2026 (est.) |
| Last Earnings Release | May. 15, 2026 |
| Next Ex-Dividend Date | N/A |
| Last Ex-Dividend Date | May. 28, 2014 |