

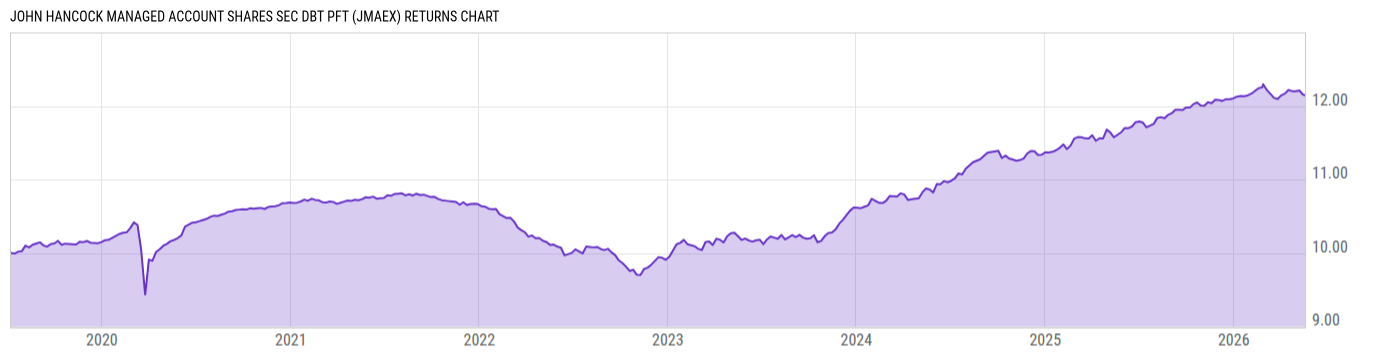
John Hancock Managed Account Shares Sec Dbt Pft (JMAEX)
9.43
-0.01
(-0.11%)
USD |
Jun 08 2026
Returns Chart
Key Stats
| Net Expense Ratio | Total Assets Under Management | Weighted Average Dividend Yield | Turnover Ratio (Generic) |
|---|---|---|---|
| 0.00% | 319.47M | -- | 27.00% |
| 1 Year Fund Level Flows | 1 Year Total Returns (Daily) | Annualized Total Returns Since Inception (Daily) | Max Drawdown (Since Inception) |
| 106.61M | 4.52% |
Basic Info
| Investment Strategy | |
| The Fund seeks high level of current income consistent with prudent investment risk. The Fund invests at least 80% of its assets in securitized assets, which may include, but are not limited to, mortgage-backed and asset-backed securities, including securities backed by the US Government and its agencies. |
| General | |
| Security Type | Mutual Fund |
| Equity Style | -- |
| Broad Asset Class | Taxable Bond |
| Broad Category | Fixed Income |
| Global Peer Group | Bond USD Mortgages |
| Peer Group | U.S. Mortgage Funds |
| Global Macro | Bond HC |
| US Macro | U.S. Government & Treasury Fixed Income Funds |
| YCharts Categorization | -- |
| YCharts Benchmark | -- |
| Prospectus Objective | U.S. Mortgage Funds |
| Fund Owner Firm Name | John Hancock Group |
| Broad Asset Class Benchmark Index | |
| ^BBUSATR | 100.0% |
Net Fund Flows Versus Peer Group
1 Month
% Rank:
23
-105.93M
Peer Group Low
315.90M
Peer Group High
1 Year
% Rank:
33
106.61M
-2.129B
Peer Group Low
1.463B
Peer Group High
3 Months
% Rank:
28
-583.12M
Peer Group Low
530.19M
Peer Group High
3 Years
% Rank:
30
-6.769B
Peer Group Low
7.386B
Peer Group High
6 Months
% Rank:
22
-1.037B
Peer Group Low
1.036B
Peer Group High
5 Years
% Rank:
30
-18.17B
Peer Group Low
10.59B
Peer Group High
YTD
% Rank:
24
-615.00M
Peer Group Low
724.64M
Peer Group High
10 Years
% Rank:
34
-35.90B
Peer Group Low
25.97B
Peer Group High
Date Unavailable
Risk
Performance Versus Peer Group
Annual Total Returns Versus Peers
As of June 09, 2026.
Asset Allocation
As of March 31, 2026.
| Type | % Net |
|---|---|
| Cash | 0.01% |
| Stock | 0.00% |
| Bond | 98.68% |
| Convertible | 0.00% |
| Preferred | 0.00% |
| Other | 1.31% |
Top 10 Holdings
| Name | % Weight | Price | % Change |
|---|---|---|---|
|
John Hancock Collateral Trust
|
1.34% | -- | -- |
|
BEACON CONTAINER FINANCE LLC 211 A FIX 2.25% 22-OCT-2046
|
1.20% | -- | -- |
|
HUDSON YARDS MORTGAGE TRUST 25SPRL A VAR 5.46684% 13-JAN-2040
|
1.00% | -- | -- |
| Progress Residential 2026-SFR1 Trust PROGRECK 02/09/2043 FIX USD Corporate RegS | 1.00% | -- | -- |
|
CLI FUNDING LLC 251 A TAC FIX 5.35% 21-JUN-2050
|
0.97% | -- | -- |
|
OBX TRUST 26NQM2 A1 FIX 4.818% 25-DEC-2065
|
0.93% | -- | -- |
|
ELLINGTON FINANCIAL MORTGAGE TRUST 25INV5 A1 FIX 5.077% 26-DEC-2070
|
0.91% | -- | -- |
|
BBCMS TRUST 245C29 A3 FIX 5.208% 17-SEP-2057
|
0.91% | -- | -- |
|
GCAT TRUST 25NQM5 A1 FIX 4.981% 25-AUG-2070
|
0.88% | -- | -- |
|
PROGRESS RESIDENTIAL MASTER TRUST 25SFR6 A SEQ FIX 4% 17-DEC-2042
|
0.87% | -- | -- |
Fees & Availability
| Fees | |
| Actual 12B-1 Fee | -- |
| Actual Management Fee | -- |
| Administration Fee | -- |
| Maximum Front Load | -- |
| Maximum Deferred Load | -- |
| Maximum Redemption Fee | -- |
| General Availability | |
| Available for Insurance Product | No |
| Available for RRSP | No |
| Purchase Details | |
| Open to New Investors |
|
| Minimum Initial Investment | 0.00 None |
| Minimum Subsequent Investment | 0.00 None |
Basic Info
| Investment Strategy | |
| The Fund seeks high level of current income consistent with prudent investment risk. The Fund invests at least 80% of its assets in securitized assets, which may include, but are not limited to, mortgage-backed and asset-backed securities, including securities backed by the US Government and its agencies. |
| General | |
| Security Type | Mutual Fund |
| Equity Style | -- |
| Broad Asset Class | Taxable Bond |
| Broad Category | Fixed Income |
| Global Peer Group | Bond USD Mortgages |
| Peer Group | U.S. Mortgage Funds |
| Global Macro | Bond HC |
| US Macro | U.S. Government & Treasury Fixed Income Funds |
| YCharts Categorization | -- |
| YCharts Benchmark | -- |
| Prospectus Objective | U.S. Mortgage Funds |
| Fund Owner Firm Name | John Hancock Group |
| Broad Asset Class Benchmark Index | |
| ^BBUSATR | 100.0% |
Fundamentals
| General | |
| Distribution Yield | -- |
| Dividend Yield TTM (6-5-26) | 4.95% |
| 30-Day SEC Yield (4-30-26) | 4.83% |
| 7-Day SEC Yield | -- |
| Number of Holdings | 309 |
| Bond | |
| Yield to Maturity (3-31-26) | 5.57% |
| Effective Duration | -- |
| Average Coupon | 4.06% |
| Calculated Average Quality | 2.030 |
| Effective Maturity | 29.02 |
| Nominal Maturity | 29.02 |
| Number of Bond Holdings | 292 |
As of March 31, 2026
Fund Details
| Key Dates | |
| Inception Date | 7/9/2019 |
| Last Annual Report Date | 5/31/2025 |
| Last Prospectus Date | 10/1/2025 |
| Attributes | |
| Index Fund | -- |
| Inverse Fund | No |
| Leveraged Fund | -- |
| Fund of Funds | No |
| Currency Hedged Fund | -- |
| Socially Responsible Fund | No |
Top Portfolio Holders
| Name | % Weight |
|---|---|
| Portfolio A | 5.00% |
| Portfolio B | 3.50% |
| Portfolio C | 2.25% |
Excel Add-In Codes
| Name: =YCI("M:JMAEX", "name") |
| Broad Asset Class: =YCI("M:JMAEX", "broad_asset_class") |
| Broad Category: =YCI("M:JMAEX", "broad_category_group") |
| Prospectus Objective: =YCI("M:JMAEX", "prospectus_objective") |
| To find the codes for any of our securities and financial metrics, see our Complete Excel Reference. |