

Vanguard Communication Services Index Fund Admiral (VTCAX)
95.55
+0.17
(+0.18%)
USD |
Jun 09 2026
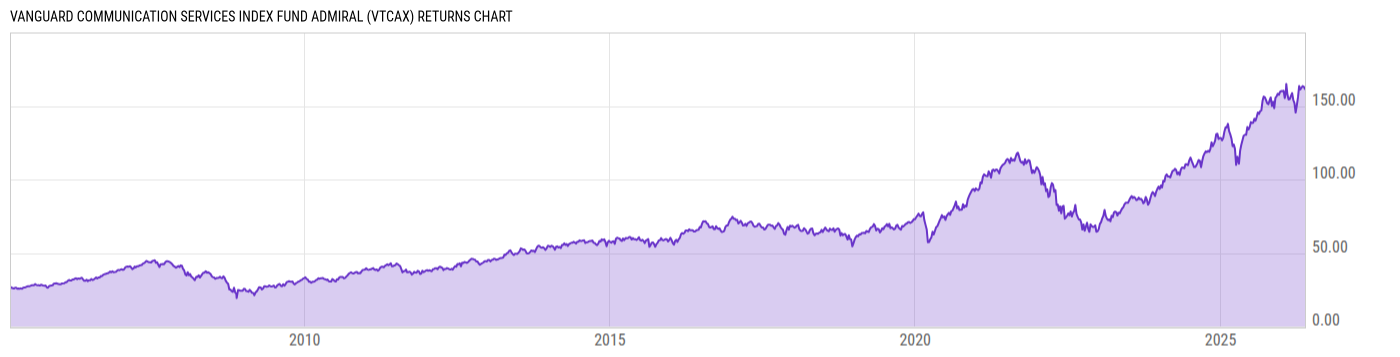
Returns Chart
Key Stats
| Net Expense Ratio | Total Assets Under Management | Weighted Average Dividend Yield | Turnover Ratio (Generic) |
|---|---|---|---|
| 0.09% | 6.293B | 0.94% | 12.00% |
| 1 Year Fund Level Flows | 1 Year Total Returns (Daily) | Annualized Total Returns Since Inception (Daily) | Max Drawdown (Since Inception) |
| 150.99M | 15.49% |
Basic Info
| Investment Strategy | |
| The Fund seeks to track the performance of a benchmark index that measures the investment return of telecommunication services stocks. The Fund employs an indexing investment approach designed to track the performance of the MSCI US Investable Market Telecommunication Services Index. |
| General | |
| Security Type | Mutual Fund |
| Equity Style | Multi Cap Value |
| Broad Asset Class | Sector Equity |
| Broad Category | Equity |
| Global Peer Group | Equity Sector Communication Services |
| Peer Group | Telecommunication Funds |
| Global Macro | Equity Industry Sector |
| US Macro | Sector Equity Funds |
| YCharts Categorization | -- |
| YCharts Benchmark | -- |
| Prospectus Objective | Telecommunication Funds |
| Fund Owner Firm Name | Vanguard |
| Broad Asset Class Benchmark Index | |
| ^MSWNTR | 100.0% |
Net Fund Flows Versus Peer Group
1 Month
% Rank:
90
-402.10M
Peer Group Low
143.59M
Peer Group High
1 Year
% Rank:
13
150.99M
-2.030B
Peer Group Low
523.04M
Peer Group High
3 Months
% Rank:
90
-1.637B
Peer Group Low
434.41M
Peer Group High
3 Years
% Rank:
13
-2.997B
Peer Group Low
566.07M
Peer Group High
6 Months
% Rank:
90
-1.391B
Peer Group Low
476.20M
Peer Group High
5 Years
% Rank:
10
-4.593B
Peer Group Low
1.799B
Peer Group High
YTD
% Rank:
90
-1.716B
Peer Group Low
476.33M
Peer Group High
10 Years
% Rank:
8
-4.129B
Peer Group Low
10.46B
Peer Group High
Date Unavailable
Risk
Performance Versus Peer Group
Annual Total Returns Versus Peers
As of June 10, 2026.
Asset Allocation
As of April 30, 2026.
| Type | % Net |
|---|---|
| Cash | 0.00% |
| Stock | 99.05% |
| Bond | 0.00% |
| Convertible | 0.00% |
| Preferred | 0.00% |
| Other | 0.95% |
Top 10 Holdings
| Name | % Weight | Price | % Change |
|---|---|---|---|
| Meta Platforms, Inc. | 20.26% | 570.96 | -2.33% |
| Alphabet, Inc. | 16.18% | 356.50 | -2.13% |
| Alphabet, Inc. | 10.68% | 353.43 | -2.45% |
| Netflix, Inc. | 5.15% | 82.00 | 0.72% |
| Verizon Communications, Inc. | 4.16% | 46.94 | 2.53% |
| The Walt Disney Co. | 4.00% | 98.61 | -0.72% |
| AT&T, Inc. | 3.86% | 23.20 | 2.14% |
| Warner Bros. Discovery, Inc. | 2.72% | 26.24 | -1.20% |
| T-Mobile US, Inc. | 2.59% | 185.54 | 3.39% |
| Comcast Corp. | 2.54% | 23.97 | 0.50% |
Fees & Availability
| Fees | |
| Actual 12B-1 Fee | -- |
| Actual Management Fee | 0.08% |
| Administration Fee | 215.0K% |
| Maximum Front Load | -- |
| Maximum Deferred Load | -- |
| Maximum Redemption Fee | 0.00% |
| General Availability | |
| Available for Insurance Product | -- |
| Available for RRSP | -- |
| Purchase Details | |
| Open to New Investors |
|
| Minimum Initial Investment | 100000.0 None |
| Minimum Subsequent Investment | 1.00 None |
Basic Info
| Investment Strategy | |
| The Fund seeks to track the performance of a benchmark index that measures the investment return of telecommunication services stocks. The Fund employs an indexing investment approach designed to track the performance of the MSCI US Investable Market Telecommunication Services Index. |
| General | |
| Security Type | Mutual Fund |
| Equity Style | Multi Cap Value |
| Broad Asset Class | Sector Equity |
| Broad Category | Equity |
| Global Peer Group | Equity Sector Communication Services |
| Peer Group | Telecommunication Funds |
| Global Macro | Equity Industry Sector |
| US Macro | Sector Equity Funds |
| YCharts Categorization | -- |
| YCharts Benchmark | -- |
| Prospectus Objective | Telecommunication Funds |
| Fund Owner Firm Name | Vanguard |
| Broad Asset Class Benchmark Index | |
| ^MSWNTR | 100.0% |
Fundamentals
| General | |
| Distribution Yield | -- |
| Dividend Yield TTM (6-8-26) | 1.01% |
| 30-Day SEC Yield (5-31-26) | 0.87% |
| 7-Day SEC Yield | -- |
| Number of Holdings | 118 |
| Stock | |
| Weighted Average PE Ratio | 26.31 |
| Weighted Average Price to Sales Ratio | 8.168 |
| Weighted Average Price to Book Ratio | 7.171 |
| Weighted Median ROE | 18.30% |
| Weighted Median ROA | 14.24% |
| ROI (TTM) | 16.67% |
| Return on Investment (TTM) | 16.67% |
| Earning Yield | 0.0523 |
| LT Debt / Shareholders Equity | 0.7832 |
| Number of Equity Holdings | 114 |
As of April 30, 2026
Growth Metrics
| EPS Growth (1Y) | 29.22% |
| EPS Growth (3Y) | 33.35% |
| EPS Growth (5Y) | 17.81% |
| Sales Growth (1Y) | 14.10% |
| Sales Growth (3Y) | 13.19% |
| Sales Growth (5Y) | 16.14% |
| Sales per Share Growth (1Y) | 21.32% |
| Sales per Share Growth (3Y) | 12.42% |
| Operating Cash Flow - Growth Rate (3Y) | 26.96% |
As of April 30, 2026
Fund Details
| Key Dates | |
| Inception Date | 3/11/2005 |
| Last Annual Report Date | 8/31/2025 |
| Last Prospectus Date | 12/19/2025 |
| Attributes | |
| Index Fund |
|
| Inverse Fund | -- |
| Leveraged Fund | -- |
| Fund of Funds | No |
| Currency Hedged Fund | -- |
| Socially Responsible Fund | No |
Top Portfolio Holders
| Name | % Weight |
|---|---|
| Portfolio A | 5.00% |
| Portfolio B | 3.50% |
| Portfolio C | 2.25% |
Excel Add-In Codes
| Name: =YCI("M:VTCAX", "name") |
| Broad Asset Class: =YCI("M:VTCAX", "broad_asset_class") |
| Broad Category: =YCI("M:VTCAX", "broad_category_group") |
| Prospectus Objective: =YCI("M:VTCAX", "prospectus_objective") |
| To find the codes for any of our securities and financial metrics, see our Complete Excel Reference. |