

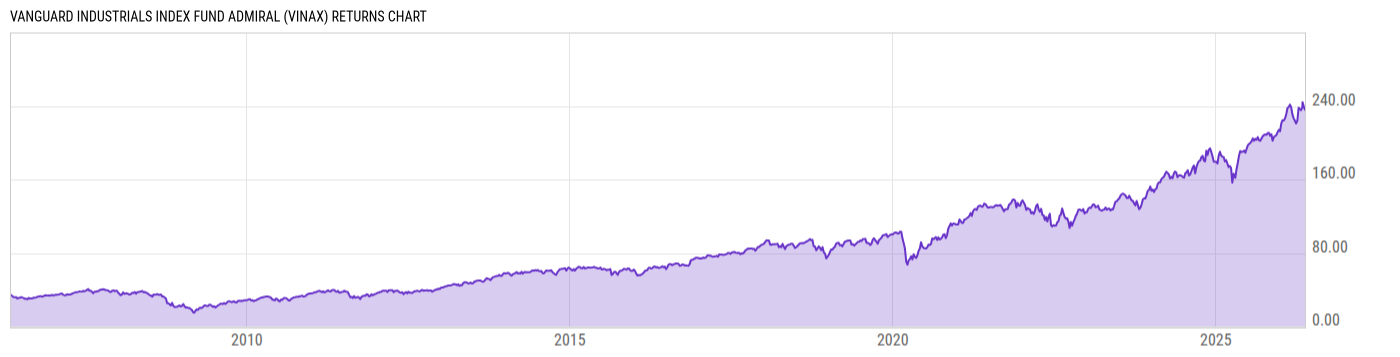
Vanguard Industrials Index Fund Admiral (VINAX)
176.09
+1.91
(+1.10%)
USD |
Jun 09 2026
Returns Chart
Key Stats
| Net Expense Ratio | Total Assets Under Management | Weighted Average Dividend Yield | Turnover Ratio (Generic) |
|---|---|---|---|
| 0.09% | 8.357B | 0.99% | 5.00% |
| 1 Year Fund Level Flows | 1 Year Total Returns (Daily) | Annualized Total Returns Since Inception (Daily) | Max Drawdown (Since Inception) |
| 845.02M | 26.14% |
Basic Info
| Investment Strategy | |
| The Fund seeks to track the performance of a benchmark index that measures the investment return of industrial stocks. Specifically the MSCI U.S. Investable Market Industrials Index, an index of stocks of large-, mid-, and small-size U.S. companies within the industrial sector. |
| General | |
| Security Type | Mutual Fund |
| Equity Style | Multi Cap Core |
| Broad Asset Class | Sector Equity |
| Broad Category | Equity |
| Global Peer Group | Equity Sector Industrials |
| Peer Group | Industrials Funds |
| Global Macro | Equity Industry Sector |
| US Macro | Sector Equity Funds |
| YCharts Categorization | -- |
| YCharts Benchmark | -- |
| Prospectus Objective | Industrials Funds |
| Fund Owner Firm Name | Vanguard |
| Broad Asset Class Benchmark Index | |
| ^MSWNTR | 100.0% |
Net Fund Flows Versus Peer Group
1 Month
% Rank:
22
-745.93M
Peer Group Low
506.10M
Peer Group High
1 Year
% Rank:
17
845.02M
-1.351B
Peer Group Low
5.136B
Peer Group High
3 Months
% Rank:
10
-1.088B
Peer Group Low
3.791B
Peer Group High
3 Years
% Rank:
13
-1.642B
Peer Group Low
7.152B
Peer Group High
6 Months
% Rank:
13
-1.192B
Peer Group Low
3.835B
Peer Group High
5 Years
% Rank:
95
-2.192B
Peer Group Low
7.152B
Peer Group High
YTD
% Rank:
13
-595.03M
Peer Group Low
3.836B
Peer Group High
10 Years
% Rank:
18
-754.76M
Peer Group Low
7.519B
Peer Group High
Date Unavailable
Risk
Performance Versus Peer Group
Annual Total Returns Versus Peers
As of June 10, 2026.
Asset Allocation
As of April 30, 2026.
| Type | % Net |
|---|---|
| Cash | -0.06% |
| Stock | 99.19% |
| Bond | 0.00% |
| Convertible | 0.00% |
| Preferred | 0.00% |
| Other | 0.87% |
Top 10 Holdings
| Name | % Weight | Price | % Change |
|---|---|---|---|
| Caterpillar, Inc. | 5.88% | 914.70 | -0.10% |
| GE Aerospace | 4.32% | 330.44 | 2.61% |
| GE Vernova, Inc. | 4.15% | 920.15 | -1.47% |
| RTX Corp. | 3.33% | 181.56 | 1.62% |
| The Boeing Co. | 2.53% | 214.51 | -0.65% |
| Eaton Corp. Plc | 2.37% | 401.72 | -0.35% |
| Deere & Co. | 2.14% | 577.33 | 0.64% |
| Uber Technologies, Inc. | 2.08% | 70.38 | 0.46% |
| Union Pacific Corp. | 1.93% | 271.28 | 0.97% |
| Honeywell International, Inc. | 1.92% | 215.70 | 1.84% |
Fees & Availability
| Fees | |
| Actual 12B-1 Fee | -- |
| Actual Management Fee | 0.08% |
| Administration Fee | 314.0K% |
| Maximum Front Load | -- |
| Maximum Deferred Load | -- |
| Maximum Redemption Fee | 0.00% |
| General Availability | |
| Available for Insurance Product | -- |
| Available for RRSP | -- |
| Purchase Details | |
| Open to New Investors |
|
| Minimum Initial Investment | 100000.0 None |
| Minimum Subsequent Investment | 1.00 None |
Basic Info
| Investment Strategy | |
| The Fund seeks to track the performance of a benchmark index that measures the investment return of industrial stocks. Specifically the MSCI U.S. Investable Market Industrials Index, an index of stocks of large-, mid-, and small-size U.S. companies within the industrial sector. |
| General | |
| Security Type | Mutual Fund |
| Equity Style | Multi Cap Core |
| Broad Asset Class | Sector Equity |
| Broad Category | Equity |
| Global Peer Group | Equity Sector Industrials |
| Peer Group | Industrials Funds |
| Global Macro | Equity Industry Sector |
| US Macro | Sector Equity Funds |
| YCharts Categorization | -- |
| YCharts Benchmark | -- |
| Prospectus Objective | Industrials Funds |
| Fund Owner Firm Name | Vanguard |
| Broad Asset Class Benchmark Index | |
| ^MSWNTR | 100.0% |
Fundamentals
| General | |
| Distribution Yield | -- |
| Dividend Yield TTM (6-8-26) | 0.89% |
| 30-Day SEC Yield (5-31-26) | 0.91% |
| 7-Day SEC Yield | -- |
| Number of Holdings | 388 |
| Stock | |
| Weighted Average PE Ratio | 35.62 |
| Weighted Average Price to Sales Ratio | 5.250 |
| Weighted Average Price to Book Ratio | 10.55 |
| Weighted Median ROE | 51.98% |
| Weighted Median ROA | 8.29% |
| ROI (TTM) | 13.18% |
| Return on Investment (TTM) | 13.18% |
| Earning Yield | 0.0334 |
| LT Debt / Shareholders Equity | 1.225 |
| Number of Equity Holdings | 383 |
As of April 30, 2026
Growth Metrics
| EPS Growth (1Y) | 15.40% |
| EPS Growth (3Y) | 17.95% |
| EPS Growth (5Y) | 15.85% |
| Sales Growth (1Y) | 8.33% |
| Sales Growth (3Y) | 7.91% |
| Sales Growth (5Y) | 9.43% |
| Sales per Share Growth (1Y) | 37.24% |
| Sales per Share Growth (3Y) | 8.34% |
| Operating Cash Flow - Growth Rate (3Y) | 18.28% |
As of April 30, 2026
Fund Details
| Key Dates | |
| Inception Date | 5/8/2006 |
| Last Annual Report Date | 8/31/2025 |
| Last Prospectus Date | 12/19/2025 |
| Attributes | |
| Index Fund |
|
| Inverse Fund | -- |
| Leveraged Fund | -- |
| Fund of Funds | No |
| Currency Hedged Fund | -- |
| Socially Responsible Fund | No |
Top Portfolio Holders
| Name | % Weight |
|---|---|
| Portfolio A | 5.00% |
| Portfolio B | 3.50% |
| Portfolio C | 2.25% |
Excel Add-In Codes
| Name: =YCI("M:VINAX", "name") |
| Broad Asset Class: =YCI("M:VINAX", "broad_asset_class") |
| Broad Category: =YCI("M:VINAX", "broad_category_group") |
| Prospectus Objective: =YCI("M:VINAX", "prospectus_objective") |
| To find the codes for any of our securities and financial metrics, see our Complete Excel Reference. |