

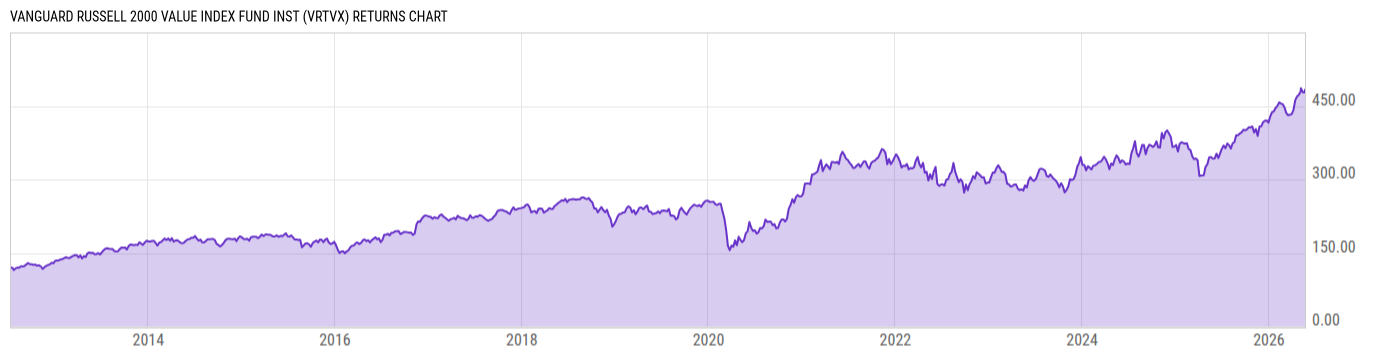
Vanguard Russell 2000 Value Index Fund Inst (VRTVX)
367.27
+2.31
(+0.63%)
USD |
May 22 2026
Returns Chart
Key Stats
| Net Expense Ratio | Total Assets Under Management | Weighted Average Dividend Yield | Turnover Ratio (Generic) |
|---|---|---|---|
| 0.05% | 1.101B | 1.87% | 26.00% |
| 1 Year Fund Level Flows | 1 Year Total Returns (Daily) | Annualized Total Returns Since Inception (Daily) | Max Drawdown (Since Inception) |
| 97.62M | 44.23% |
Basic Info
| Investment Strategy | |
| The Fund seeks to track the performance of a benchmark index that measures the investment return of small-capitalization value stocks in the United States. The Fund attempts to replicate the Russell 2000 Value Index by investing all, or substantially all its assets in the stocks that make up the Index. |
| General | |
| Security Type | Mutual Fund |
| Equity Style | Small Cap Value |
| Broad Asset Class | US Equity |
| Broad Category | Equity |
| Global Peer Group | Equity US Sm&Mid Cap |
| Peer Group | Small-Cap Value Funds |
| Global Macro | Equity North America |
| US Macro | Small-Cap Funds |
| YCharts Categorization | -- |
| YCharts Benchmark | -- |
| Prospectus Objective | Small-Cap Funds |
| Fund Owner Firm Name | Vanguard |
| Broad Asset Class Benchmark Index | |
| ^SPXTR | 100.0% |
Net Fund Flows Versus Peer Group
1 Month
% Rank:
19
-327.65M
Peer Group Low
645.12M
Peer Group High
1 Year
% Rank:
13
97.62M
-1.759B
Peer Group Low
4.582B
Peer Group High
3 Months
% Rank:
10
-493.33M
Peer Group Low
1.615B
Peer Group High
3 Years
% Rank:
63
-3.325B
Peer Group Low
12.92B
Peer Group High
6 Months
% Rank:
7
-1.270B
Peer Group Low
2.911B
Peer Group High
5 Years
% Rank:
54
-6.957B
Peer Group Low
17.35B
Peer Group High
YTD
% Rank:
7
-678.89M
Peer Group Low
2.366B
Peer Group High
10 Years
% Rank:
9
-9.794B
Peer Group Low
18.10B
Peer Group High
Date Unavailable
Risk
Performance Versus Peer Group
Annual Total Returns Versus Peers
As of May 24, 2026.
Asset Allocation
As of March 31, 2026.
| Type | % Net |
|---|---|
| Cash | 0.05% |
| Stock | 99.25% |
| Bond | 0.00% |
| Convertible | 0.00% |
| Preferred | 0.00% |
| Other | 0.70% |
Top 10 Holdings
| Name | % Weight | Price | % Change |
|---|---|---|---|
| EchoStar Corp. | 1.05% | 124.20 | -3.30% |
| TTM Technologies, Inc. | 1.02% | 189.92 | 8.81% |
|
Vanguard Market Liquidity Fund
|
0.64% | -- | -- |
| Coeur Mining, Inc. | 0.58% | 17.63 | -1.12% |
| Hecla Mining Co. | 0.55% | 16.98 | -1.85% |
| Fluor Corp. | 0.54% | 44.87 | 0.63% |
| UMB Financial Corp. | 0.53% | 131.21 | 0.20% |
| ViaSat, Inc. | 0.51% | 74.56 | 5.37% |
| CareTrust REIT, Inc. | 0.50% | 41.14 | 0.32% |
| Jackson Financial, Inc. | 0.49% | 106.95 | -1.16% |
Fees & Availability
| Fees | |
| Actual 12B-1 Fee | -- |
| Actual Management Fee | 0.03% |
| Administration Fee | 42.00K% |
| Maximum Front Load | -- |
| Maximum Deferred Load | -- |
| Maximum Redemption Fee | -- |
| General Availability | |
| Available for Insurance Product | No |
| Available for RRSP | No |
| Purchase Details | |
| Open to New Investors |
|
| Minimum Initial Investment | 5.00M None |
| Minimum Subsequent Investment | 1.00 None |
Basic Info
| Investment Strategy | |
| The Fund seeks to track the performance of a benchmark index that measures the investment return of small-capitalization value stocks in the United States. The Fund attempts to replicate the Russell 2000 Value Index by investing all, or substantially all its assets in the stocks that make up the Index. |
| General | |
| Security Type | Mutual Fund |
| Equity Style | Small Cap Value |
| Broad Asset Class | US Equity |
| Broad Category | Equity |
| Global Peer Group | Equity US Sm&Mid Cap |
| Peer Group | Small-Cap Value Funds |
| Global Macro | Equity North America |
| US Macro | Small-Cap Funds |
| YCharts Categorization | -- |
| YCharts Benchmark | -- |
| Prospectus Objective | Small-Cap Funds |
| Fund Owner Firm Name | Vanguard |
| Broad Asset Class Benchmark Index | |
| ^SPXTR | 100.0% |
Fundamentals
| General | |
| Distribution Yield | -- |
| Dividend Yield TTM (5-21-26) | 1.61% |
| 30-Day SEC Yield (4-30-26) | 1.70% |
| 7-Day SEC Yield | -- |
| Number of Holdings | 1431 |
| Stock | |
| Weighted Average PE Ratio | 22.93 |
| Weighted Average Price to Sales Ratio | 4.390 |
| Weighted Average Price to Book Ratio | 2.242 |
| Weighted Median ROE | -1.77% |
| Weighted Median ROA | -1.39% |
| ROI (TTM) | 0.59% |
| Return on Investment (TTM) | 0.59% |
| Earning Yield | 0.0653 |
| LT Debt / Shareholders Equity | 0.8970 |
| Number of Equity Holdings | 1425 |
As of March 31, 2026
Growth Metrics
| EPS Growth (1Y) | 12.46% |
| EPS Growth (3Y) | -0.43% |
| EPS Growth (5Y) | 9.99% |
| Sales Growth (1Y) | 11.73% |
| Sales Growth (3Y) | 7.44% |
| Sales Growth (5Y) | 10.86% |
| Sales per Share Growth (1Y) | 85.44% |
| Sales per Share Growth (3Y) | 3.70% |
| Operating Cash Flow - Growth Rate (3Y) | 20.75% |
As of March 31, 2026
Fund Details
| Key Dates | |
| Inception Date | 7/13/2012 |
| Last Annual Report Date | 8/31/2025 |
| Last Prospectus Date | 2/2/2026 |
| Attributes | |
| Index Fund |
|
| Inverse Fund | No |
| Leveraged Fund | -- |
| Fund of Funds | No |
| Currency Hedged Fund | -- |
| Socially Responsible Fund | No |
Top Portfolio Holders
| Name | % Weight |
|---|---|
| Portfolio A | 5.00% |
| Portfolio B | 3.50% |
| Portfolio C | 2.25% |
Excel Add-In Codes
| Name: =YCI("M:VRTVX", "name") |
| Broad Asset Class: =YCI("M:VRTVX", "broad_asset_class") |
| Broad Category: =YCI("M:VRTVX", "broad_category_group") |
| Prospectus Objective: =YCI("M:VRTVX", "prospectus_objective") |
| To find the codes for any of our securities and financial metrics, see our Complete Excel Reference. |