

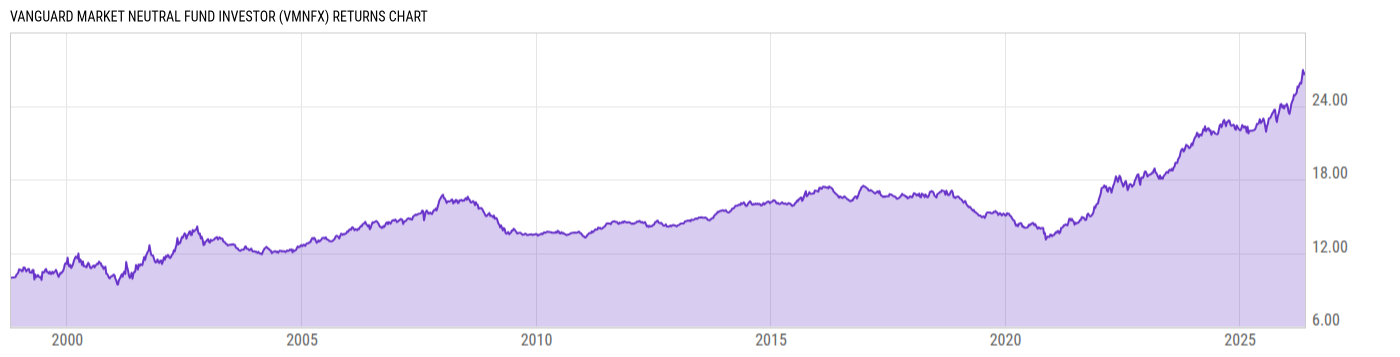
Vanguard Market Neutral Fund Investor (VMNFX)
15.67
-0.04
(-0.25%)
USD |
Jun 09 2026
Returns Chart
Key Stats
| Net Expense Ratio | Total Assets Under Management | Weighted Average Dividend Yield | Turnover Ratio (Generic) |
|---|---|---|---|
| 0.20% | 561.94M | -- | 108.0% |
| 1 Year Fund Level Flows | 1 Year Total Returns (Daily) | Annualized Total Returns Since Inception (Daily) | Max Drawdown (Since Inception) |
| 119.70M | 19.46% |
Basic Info
| Investment Strategy | |
| The Fund seeks to provide long-term capital appreciation while limiting exposure to general stock market risk. The Fund follows a market neutral strategy, which the Fund defines as a strategy designed to produce a portfolio that is neutral with respect to general stock market risk sometimes referred to as beta neutrality. |
| General | |
| Security Type | Mutual Fund |
| Equity Style | -- |
| Broad Asset Class | Alternative |
| Broad Category | Alternative Strategies |
| Global Peer Group | Alternative Equity Market Neutral |
| Peer Group | Alternative Equity Market Neutral Funds |
| Global Macro | Alternative Equity |
| US Macro | Alternative Equity Funds |
| YCharts Categorization | -- |
| YCharts Benchmark | -- |
| Prospectus Objective | Alternative Equity Market Neutral Funds |
| Fund Owner Firm Name | Vanguard |
| Broad Asset Class Benchmark Index | |
| ^MSACWINTR | 100.0% |
Net Fund Flows Versus Peer Group
1 Month
% Rank:
31
-20.76M
Peer Group Low
110.08M
Peer Group High
1 Year
% Rank:
43
119.70M
-81.56M
Peer Group Low
847.70M
Peer Group High
3 Months
% Rank:
31
-154.09M
Peer Group Low
365.61M
Peer Group High
3 Years
% Rank:
85
-397.65M
Peer Group Low
2.378B
Peer Group High
6 Months
% Rank:
41
-45.60M
Peer Group Low
375.45M
Peer Group High
5 Years
% Rank:
65
-562.78M
Peer Group Low
2.502B
Peer Group High
YTD
% Rank:
33
-177.24M
Peer Group Low
404.09M
Peer Group High
10 Years
% Rank:
99
-1.191B
Peer Group Low
9.311B
Peer Group High
Date Unavailable
Risk
Performance Versus Peer Group
Annual Total Returns Versus Peers
As of June 10, 2026.
Asset Allocation
As of December 31, 2025.
| Type | % Net |
|---|---|
| Cash | 96.49% |
| Stock | 0.72% |
| Bond | 0.00% |
| Convertible | 0.00% |
| Preferred | 0.00% |
| Other | 2.79% |
Top 10 Holdings
| Name | % Weight | Price | % Change |
|---|---|---|---|
|
USD Cash
|
99.64% | -- | -- |
| ADTRAN Holdings, Inc. | 0.84% | 14.65 | 2.73% |
| MasTec, Inc. | 0.79% | 335.01 | -5.12% |
| Constellium SE | 0.78% | 33.00 | -2.94% |
| Vertiv Holdings Co. | 0.78% | 280.00 | -3.29% |
| Edison International | 0.76% | 71.79 | 0.74% |
| Travel + Leisure Co. | 0.76% | 71.74 | -0.60% |
| Roku, Inc. | 0.75% | 119.19 | -1.42% |
| Zions Bancorporation NA | 0.75% | 66.03 | 1.85% |
| OUTFRONT Media, Inc. | 0.74% | 30.94 | 0.93% |
Fees & Availability
| Fees | |
| Actual 12B-1 Fee | -- |
| Actual Management Fee | 0.17% |
| Administration Fee | 447.0K% |
| Maximum Front Load | -- |
| Maximum Deferred Load | -- |
| Maximum Redemption Fee | 0.00% |
| General Availability | |
| Available for Insurance Product | No |
| Available for RRSP | No |
| Purchase Details | |
| Open to New Investors |
|
| Minimum Initial Investment | 50000.00 None |
| Minimum Subsequent Investment | 1.00 None |
Basic Info
| Investment Strategy | |
| The Fund seeks to provide long-term capital appreciation while limiting exposure to general stock market risk. The Fund follows a market neutral strategy, which the Fund defines as a strategy designed to produce a portfolio that is neutral with respect to general stock market risk sometimes referred to as beta neutrality. |
| General | |
| Security Type | Mutual Fund |
| Equity Style | -- |
| Broad Asset Class | Alternative |
| Broad Category | Alternative Strategies |
| Global Peer Group | Alternative Equity Market Neutral |
| Peer Group | Alternative Equity Market Neutral Funds |
| Global Macro | Alternative Equity |
| US Macro | Alternative Equity Funds |
| YCharts Categorization | -- |
| YCharts Benchmark | -- |
| Prospectus Objective | Alternative Equity Market Neutral Funds |
| Fund Owner Firm Name | Vanguard |
| Broad Asset Class Benchmark Index | |
| ^MSACWINTR | 100.0% |
Fundamentals
| General | |
| Distribution Yield | -- |
| Dividend Yield TTM (6-8-26) | 3.13% |
| 30-Day SEC Yield (5-31-26) | 2.75% |
| 7-Day SEC Yield | -- |
| Number of Holdings | 597 |
Fund Details
| Key Dates | |
| Inception Date | 11/11/1998 |
| Last Annual Report Date | 12/31/2025 |
| Last Prospectus Date | 4/29/2025 |
| Share Classes | |
| VMNIX | Inst |
| Attributes | |
| Index Fund | -- |
| Inverse Fund | No |
| Leveraged Fund | -- |
| Fund of Funds | No |
| Currency Hedged Fund | -- |
| Socially Responsible Fund | No |
Top Portfolio Holders
| Name | % Weight |
|---|---|
| Portfolio A | 5.00% |
| Portfolio B | 3.50% |
| Portfolio C | 2.25% |
Excel Add-In Codes
| Name: =YCI("M:VMNFX", "name") |
| Broad Asset Class: =YCI("M:VMNFX", "broad_asset_class") |
| Broad Category: =YCI("M:VMNFX", "broad_category_group") |
| Prospectus Objective: =YCI("M:VMNFX", "prospectus_objective") |
| To find the codes for any of our securities and financial metrics, see our Complete Excel Reference. |