

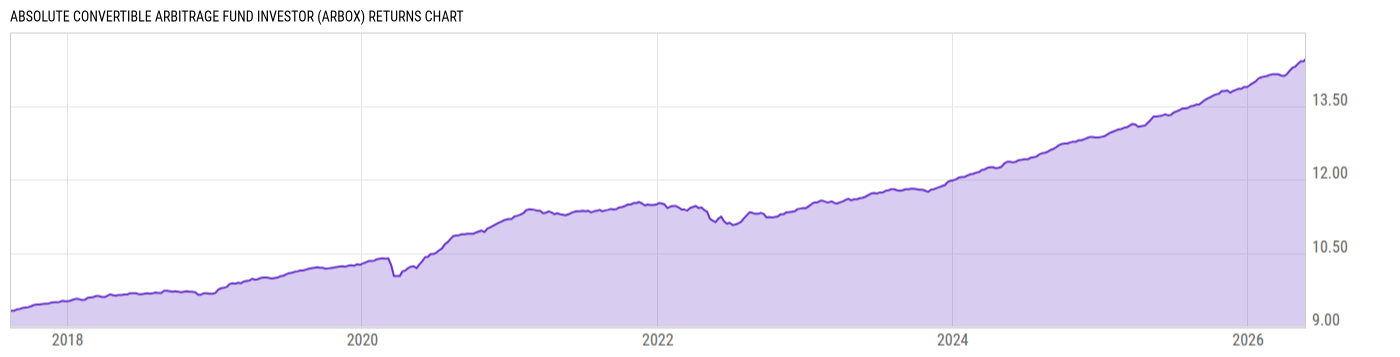
Absolute Convertible Arbitrage Fund Investor (ARBOX)
12.00
0.00 (0.00%)
USD |
Jun 09 2026
Returns Chart
Key Stats
| Net Expense Ratio | Total Assets Under Management | Weighted Average Dividend Yield | Turnover Ratio (Generic) |
|---|---|---|---|
| 1.73% | 1.768B | -- | 25.00% |
| 1 Year Fund Level Flows | 1 Year Total Returns (Daily) | Annualized Total Returns Since Inception (Daily) | Max Drawdown (Since Inception) |
| 434.87M | 8.94% |
Basic Info
| Investment Strategy | |
| The Fund seeks to achieve positive absolute returns over the long-term with low volatility when compared to traditional market indices. It invests primarily in a diversified portfolio of convertible securities. These are typically debt securities or preferred stocks that can be exchanged for, or converted to common stock. |
| General | |
| Security Type | Mutual Fund |
| Equity Style | -- |
| Broad Asset Class | Alternative |
| Broad Category | Alternative Strategies |
| Global Peer Group | Alternative Equity Market Neutral |
| Peer Group | Alternative Equity Market Neutral Funds |
| Global Macro | Alternative Equity |
| US Macro | Alternative Equity Funds |
| YCharts Categorization | -- |
| YCharts Benchmark | -- |
| Prospectus Objective | Alternative Equity Market Neutral Funds |
| Fund Owner Firm Name | Absolute Investment Advisers |
| Broad Asset Class Benchmark Index | |
| ^MSACWINTR | 100.0% |
Net Fund Flows Versus Peer Group
1 Month
% Rank:
26
-20.76M
Peer Group Low
110.08M
Peer Group High
1 Year
% Rank:
24
434.87M
-81.56M
Peer Group Low
847.70M
Peer Group High
3 Months
% Rank:
11
-154.09M
Peer Group Low
365.61M
Peer Group High
3 Years
% Rank:
16
-397.65M
Peer Group Low
2.378B
Peer Group High
6 Months
% Rank:
11
-45.60M
Peer Group Low
375.45M
Peer Group High
5 Years
% Rank:
31
-562.78M
Peer Group Low
2.502B
Peer Group High
YTD
% Rank:
14
-177.24M
Peer Group Low
404.09M
Peer Group High
10 Years
% Rank:
31
-1.191B
Peer Group Low
9.311B
Peer Group High
Date Unavailable
Risk
Performance Versus Peer Group
Annual Total Returns Versus Peers
As of June 10, 2026.
Asset Allocation
As of March 31, 2026.
| Type | % Net |
|---|---|
| Cash | 45.85% |
| Stock | -35.19% |
| Bond | 88.82% |
| Convertible | 0.00% |
| Preferred | 0.18% |
| Other | 0.34% |
Top 10 Holdings
| Name | % Weight | Price | % Change |
|---|---|---|---|
|
USD Cash
|
36.99% | -- | -- |
| First American Treasury Obligations Fund X | 17.47% | 1.00 | 0.00% |
| EZCORP, INC. EZPW 3.75 12/15/2029 FIX USD Corporate 144A | 2.20% | 292.45 | 2.43% |
| Absolute Flexible Fund Inst | 2.15% | 11.74 | -0.09% |
| GRANITE CONSTRUCTION INCORPORATED GRANCON 3.25 06/15/2030 FIX USD Corporate | 1.64% | 188.25 | -0.89% |
| MKS Inc. MKSINC 1.25 06/01/2030 FIX USD Corporate 144A | 1.35% | 215.17 | 1.19% |
| Integer Holdings Corporation INTEGEH 1.875 03/15/2030 FIX USD Corporate 144A | 1.27% | 96.98 | 0.63% |
| PATRICK INDUSTRIES, INC. PATRIND 1.75 12/01/2028 FIX USD Corporate 144A | 1.26% | 142.34 | 1.46% |
| OSI Systems, Inc. OSISI 2.25 08/01/2029 FIX USD Corporate 144A | 1.23% | 134.68 | 1.04% |
| Halozyme Therapeutics, Inc. HALOTHE 1.0 08/15/2028 FIX USD Corporate | 1.19% | 136.83 | 0.69% |
Fees & Availability
| Fees | |
| Actual 12B-1 Fee | 0.25% |
| Actual Management Fee | 1.00% |
| Administration Fee | 97.19K% |
| Maximum Front Load | -- |
| Maximum Deferred Load | -- |
| Maximum Redemption Fee | -- |
| General Availability | |
| Available for Insurance Product | No |
| Available for RRSP | No |
| Purchase Details | |
| Open to New Investors |
|
| Minimum Initial Investment | 2500.00 None |
| Minimum Subsequent Investment | 0.00 None |
Basic Info
| Investment Strategy | |
| The Fund seeks to achieve positive absolute returns over the long-term with low volatility when compared to traditional market indices. It invests primarily in a diversified portfolio of convertible securities. These are typically debt securities or preferred stocks that can be exchanged for, or converted to common stock. |
| General | |
| Security Type | Mutual Fund |
| Equity Style | -- |
| Broad Asset Class | Alternative |
| Broad Category | Alternative Strategies |
| Global Peer Group | Alternative Equity Market Neutral |
| Peer Group | Alternative Equity Market Neutral Funds |
| Global Macro | Alternative Equity |
| US Macro | Alternative Equity Funds |
| YCharts Categorization | -- |
| YCharts Benchmark | -- |
| Prospectus Objective | Alternative Equity Market Neutral Funds |
| Fund Owner Firm Name | Absolute Investment Advisers |
| Broad Asset Class Benchmark Index | |
| ^MSACWINTR | 100.0% |
Fundamentals
| General | |
| Distribution Yield | -- |
| Dividend Yield TTM (6-8-26) | 1.72% |
| 30-Day SEC Yield | -- |
| 7-Day SEC Yield | -- |
| Number of Holdings | 252 |
| Stock | |
| Weighted Average PE Ratio | 60.00 |
| Weighted Average Price to Sales Ratio | 7.429 |
| Weighted Average Price to Book Ratio | 7.215 |
| Weighted Median ROE | 14.57% |
| Weighted Median ROA | 1.25% |
| ROI (TTM) | 14.60% |
| Return on Investment (TTM) | 14.60% |
| Earning Yield | 0.0167 |
| LT Debt / Shareholders Equity | 0.7245 |
| Number of Equity Holdings | 116 |
| Bond | |
| Yield to Maturity (3-31-26) | -0.99% |
| Effective Duration | -- |
| Average Coupon | 2.32% |
| Calculated Average Quality | 4.993 |
| Effective Maturity | 3.666 |
| Nominal Maturity | 3.666 |
| Number of Bond Holdings | 129 |
As of March 31, 2026
Growth Metrics
| EPS Growth (1Y) | 10.89% |
| EPS Growth (3Y) | 1.83% |
| EPS Growth (5Y) | 5.58% |
| Sales Growth (1Y) | -5.73% |
| Sales Growth (3Y) | 21.87% |
| Sales Growth (5Y) | 17.61% |
| Sales per Share Growth (1Y) | -1.36% |
| Sales per Share Growth (3Y) | 13.90% |
| Operating Cash Flow - Growth Rate (3Y) | -11.40% |
As of March 31, 2026
Fund Details
| Key Dates | |
| Inception Date | 2/25/2021 |
| Last Annual Report Date | 3/31/2025 |
| Last Prospectus Date | 8/1/2025 |
| Share Classes | |
| ARBIX | Inst |
| Attributes | |
| Index Fund | -- |
| Inverse Fund | No |
| Leveraged Fund | -- |
| Fund of Funds | No |
| Currency Hedged Fund | -- |
| Socially Responsible Fund | No |
Top Portfolio Holders
| Name | % Weight |
|---|---|
| Portfolio A | 5.00% |
| Portfolio B | 3.50% |
| Portfolio C | 2.25% |
Excel Add-In Codes
| Name: =YCI("M:ARBOX", "name") |
| Broad Asset Class: =YCI("M:ARBOX", "broad_asset_class") |
| Broad Category: =YCI("M:ARBOX", "broad_category_group") |
| Prospectus Objective: =YCI("M:ARBOX", "prospectus_objective") |
| To find the codes for any of our securities and financial metrics, see our Complete Excel Reference. |