

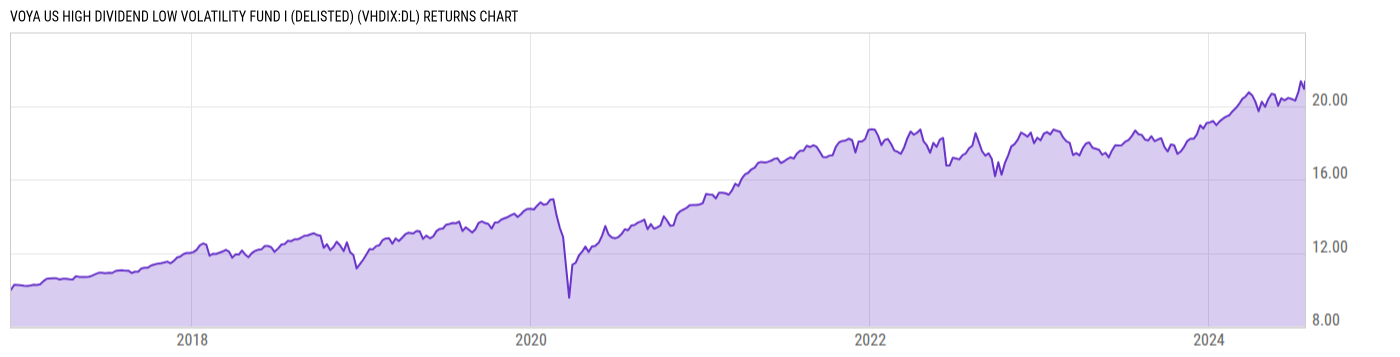
Voya US High Dividend Low Volatility Fund I (DELISTED) (VHDIX:DL)
11.34
+0.15
(+1.34%)
USD |
Jul 26 2024
Returns Chart
Key Stats
| Net Expense Ratio | Total Assets Under Management | Weighted Average Dividend Yield | Turnover Ratio (Generic) |
|---|---|---|---|
| -- | -- | 2.67% | 76.00% |
| 1 Year Fund Level Flows | 1 Year Total Returns (Daily) | Annualized Total Returns Since Inception (Daily) | Max Drawdown (Since Inception) |
| -76.14M | 14.28% |
Basic Info
| Investment Strategy | |
| -- |
| General | |
| Security Type | Mutual Fund |
| Equity Style | Multi Cap Value |
| Broad Asset Class | -- |
| Broad Category | -- |
| Global Peer Group | Equity US Income |
| Peer Group | Equity Income Funds |
| Global Macro | Equity North America |
| US Macro | Equity Income Funds |
| YCharts Categorization | -- |
| YCharts Benchmark | -- |
| Prospectus Objective | -- |
| Fund Owner Firm Name | Voya |
| Broad Asset Class Benchmark Index | |
| ^SPXTR | 100.0% |
Net Fund Flows Versus Peer Group
1 Month
% Rank:
39
-498.83M
Peer Group Low
774.58M
Peer Group High
1 Year
% Rank:
50
-76.14M
-7.923B
Peer Group Low
5.134B
Peer Group High
3 Months
% Rank:
64
-1.530B
Peer Group Low
1.592B
Peer Group High
3 Years
% Rank:
50
-9.887B
Peer Group Low
22.70B
Peer Group High
6 Months
% Rank:
59
-3.702B
Peer Group Low
2.627B
Peer Group High
5 Years
% Rank:
57
-13.52B
Peer Group Low
32.96B
Peer Group High
YTD
% Rank:
55
-4.735B
Peer Group Low
2.931B
Peer Group High
10 Years
% Rank:
45
-29.41B
Peer Group Low
38.09B
Peer Group High
Date Unavailable
Risk
Performance Versus Peer Group
Annual Total Returns Versus Peers
As of May 27, 2026.
*Indicates data for the year is incomplete.
Asset Allocation
As of May 31, 2024.
| Type | % Net |
|---|---|
| Cash | 0.15% |
| Stock | 99.75% |
| Bond | 0.10% |
| Convertible | 0.00% |
| Preferred | 0.00% |
| Other | 0.00% |
Top 10 Holdings
| Name | % Weight | Price | % Change |
|---|---|---|---|
| UnitedHealth Group, Inc. | 2.16% | 376.86 | -2.99% |
| Johnson & Johnson | 2.05% | 230.18 | -1.78% |
| Cisco Systems, Inc. | 1.43% | 118.33 | -1.73% |
| Procter & Gamble Co. | 1.36% | 142.96 | -1.02% |
| Verizon Communications, Inc. | 1.29% | 48.49 | 0.29% |
| AbbVie, Inc. | 1.29% | 213.12 | -1.20% |
| Philip Morris International, Inc. | 1.22% | 181.53 | -3.95% |
| Comcast Corp. | 1.18% | 25.15 | -0.22% |
| AT&T, Inc. | 1.15% | 25.02 | -0.95% |
| ConocoPhillips | 1.05% | 116.57 | -3.23% |
Fees & Availability
| Fees | |
| Actual 12B-1 Fee | -- |
| Actual Management Fee | -- |
| Administration Fee | -- |
| Maximum Front Load | -- |
| Maximum Deferred Load | -- |
| Maximum Redemption Fee | -- |
| General Availability | |
| Available for Insurance Product | -- |
| Available for RRSP | -- |
| Purchase Details | |
| Open to New Investors | -- |
| Minimum Initial Investment | -- |
| Minimum Subsequent Investment | -- |
Basic Info
| Investment Strategy | |
| -- |
| General | |
| Security Type | Mutual Fund |
| Equity Style | Multi Cap Value |
| Broad Asset Class | -- |
| Broad Category | -- |
| Global Peer Group | Equity US Income |
| Peer Group | Equity Income Funds |
| Global Macro | Equity North America |
| US Macro | Equity Income Funds |
| YCharts Categorization | -- |
| YCharts Benchmark | -- |
| Prospectus Objective | -- |
| Fund Owner Firm Name | Voya |
| Broad Asset Class Benchmark Index | |
| ^SPXTR | 100.0% |
Fundamentals
| General | |
| Distribution Yield | -- |
| Dividend Yield TTM (7-26-24) | 2.42% |
| 30-Day SEC Yield (6-30-24) | 2.46% |
| 7-Day SEC Yield (1-31-20) | 2.26% |
| Number of Holdings | 0 |
| Stock | |
| Weighted Average PE Ratio | 24.04 |
| Weighted Average Price to Sales Ratio | 3.537 |
| Weighted Average Price to Book Ratio | 5.480 |
| Weighted Median ROE | 268.8% |
| Weighted Median ROA | 7.32% |
| ROI (TTM) | 13.09% |
| Return on Investment (TTM) | 13.09% |
| Earning Yield | 0.0571 |
| LT Debt / Shareholders Equity | 1.441 |
| Number of Equity Holdings | 0 |
As of May 31, 2024
Growth Metrics
| EPS Growth (1Y) | 15.08% |
| EPS Growth (3Y) | 20.09% |
| EPS Growth (5Y) | 7.78% |
| Sales Growth (1Y) | 5.26% |
| Sales Growth (3Y) | 10.99% |
| Sales Growth (5Y) | 6.96% |
| Sales per Share Growth (1Y) | 7.40% |
| Sales per Share Growth (3Y) | 11.88% |
| Operating Cash Flow - Growth Rate (3Y) | 14.16% |
As of May 31, 2024
Fund Details
| Key Dates | |
| Inception Date | -- |
| Last Annual Report Date | -- |
| Last Prospectus Date | -- |
| Attributes | |
| Index Fund | -- |
| Inverse Fund | -- |
| Leveraged Fund | -- |
| Fund of Funds | -- |
| Currency Hedged Fund | -- |
| Socially Responsible Fund | -- |
Top Portfolio Holders
| Name | % Weight |
|---|---|
| Portfolio A | 5.00% |
| Portfolio B | 3.50% |
| Portfolio C | 2.25% |
Excel Add-In Codes
| Name: =YCI("M:VHDIX:DL", "name") |
| Broad Asset Class: =YCI("M:VHDIX:DL", "broad_asset_class") |
| Broad Category: =YCI("M:VHDIX:DL", "broad_category_group") |
| Prospectus Objective: =YCI("M:VHDIX:DL", "prospectus_objective") |
| To find the codes for any of our securities and financial metrics, see our Complete Excel Reference. |