

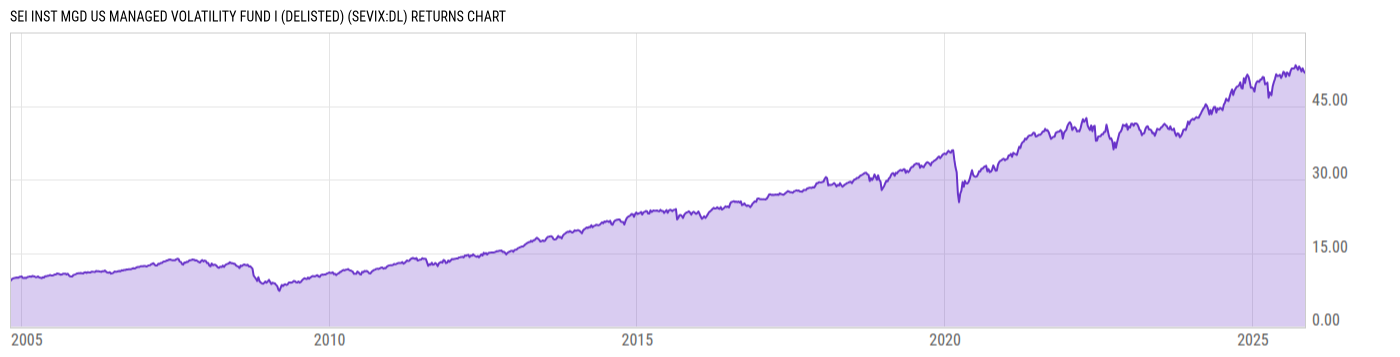
SEI Inst Mgd US Managed Volatility Fund I (DELISTED) (SEVIX:DL)
14.75
-0.05
(-0.34%)
USD |
Nov 06 2025
Returns Chart
Key Stats
| Net Expense Ratio | Total Assets Under Management | Weighted Average Dividend Yield | Turnover Ratio (Generic) |
|---|---|---|---|
| 1.38% | 528.30M | 2.06% | 54.00% |
| 1 Year Fund Level Flows | 1 Year Total Returns (Daily) | Annualized Total Returns Since Inception (Daily) | Max Drawdown (Since Inception) |
| -136.08M | 2.98% |
Basic Info
| Investment Strategy | |
| The Fund seeks capital appreciation. Utilizing multiple sub-advisers, the Fund invests in common stocks and other equity securities and employs a broad range of investment strategies intended to generate capital appreciation but with a lower level of volatility than the broad U.S. equity markets. |
| General | |
| Security Type | Mutual Fund |
| Equity Style | Multi Cap Value |
| Broad Asset Class | US Equity |
| Broad Category | Equity |
| Global Peer Group | Equity US |
| Peer Group | Multi-Cap Value Funds |
| Global Macro | Equity North America |
| US Macro | Multi-Cap Funds |
| YCharts Categorization | -- |
| YCharts Benchmark | -- |
| Prospectus Objective | Growth & Income Funds |
| Fund Owner Firm Name | SEI |
| Broad Asset Class Benchmark Index | |
| ^SPXTR | 100.0% |
Net Fund Flows Versus Peer Group
1 Month
% Rank:
82
-1.391B
Peer Group Low
2.015B
Peer Group High
1 Year
% Rank:
71
-136.08M
-7.919B
Peer Group Low
8.601B
Peer Group High
3 Months
% Rank:
69
-2.483B
Peer Group Low
4.261B
Peer Group High
3 Years
% Rank:
75
-11.51B
Peer Group Low
11.79B
Peer Group High
6 Months
% Rank:
71
-5.060B
Peer Group Low
4.371B
Peer Group High
5 Years
% Rank:
86
-14.06B
Peer Group Low
40.52B
Peer Group High
YTD
% Rank:
66
-7.806B
Peer Group Low
6.989B
Peer Group High
10 Years
% Rank:
75
-28.09B
Peer Group Low
72.32B
Peer Group High
Date Unavailable
Risk
Performance Versus Peer Group
Annual Total Returns Versus Peers
As of May 27, 2026.
*Indicates data for the year is incomplete.
Asset Allocation
As of September 30, 2025.
| Type | % Net |
|---|---|
| Cash | 0.44% |
| Stock | 98.78% |
| Bond | 0.76% |
| Convertible | 0.00% |
| Preferred | 0.00% |
| Other | 0.02% |
Top 10 Holdings
| Name | % Weight | Price | % Change |
|---|---|---|---|
| Cisco Systems, Inc. | 2.31% | 118.33 | -1.73% |
| Johnson & Johnson | 2.03% | 230.18 | -1.78% |
| AT&T, Inc. | 1.92% | 25.02 | -0.95% |
| Verizon Communications, Inc. | 1.89% | 48.49 | 0.29% |
| Electronic Arts, Inc. | 1.82% | 201.13 | 0.08% |
| Bristol Myers Squibb Co. | 1.68% | 58.03 | -2.40% |
| Microsoft Corp. | 1.66% | 416.03 | -0.61% |
| Altria Group, Inc. | 1.58% | 72.37 | -2.07% |
| Gilead Sciences, Inc. | 1.54% | 133.73 | -0.47% |
| Apple, Inc. | 1.52% | 308.33 | -0.16% |
Fees & Availability
| Fees | |
| Actual 12B-1 Fee | -- |
| Actual Management Fee | 0.55% |
| Administration Fee | 1.88K% |
| Maximum Front Load | -- |
| Maximum Deferred Load | -- |
| Maximum Redemption Fee | 0.50% |
| General Availability | |
| Available for Insurance Product | -- |
| Available for RRSP | -- |
| Purchase Details | |
| Open to New Investors |
|
| Minimum Initial Investment | 100000.0 None |
| Minimum Subsequent Investment | 1000.00 None |
Basic Info
| Investment Strategy | |
| The Fund seeks capital appreciation. Utilizing multiple sub-advisers, the Fund invests in common stocks and other equity securities and employs a broad range of investment strategies intended to generate capital appreciation but with a lower level of volatility than the broad U.S. equity markets. |
| General | |
| Security Type | Mutual Fund |
| Equity Style | Multi Cap Value |
| Broad Asset Class | US Equity |
| Broad Category | Equity |
| Global Peer Group | Equity US |
| Peer Group | Multi-Cap Value Funds |
| Global Macro | Equity North America |
| US Macro | Multi-Cap Funds |
| YCharts Categorization | -- |
| YCharts Benchmark | -- |
| Prospectus Objective | Growth & Income Funds |
| Fund Owner Firm Name | SEI |
| Broad Asset Class Benchmark Index | |
| ^SPXTR | 100.0% |
Fundamentals
| General | |
| Distribution Yield | -- |
| Dividend Yield TTM (11-5-25) | 1.16% |
| 30-Day SEC Yield (9-30-25) | 0.92% |
| 7-Day SEC Yield | -- |
| Number of Holdings | 253 |
| Stock | |
| Weighted Average PE Ratio | 25.27 |
| Weighted Average Price to Sales Ratio | 4.348 |
| Weighted Average Price to Book Ratio | 7.691 |
| Weighted Median ROE | 91.40% |
| Weighted Median ROA | 11.11% |
| ROI (TTM) | 19.62% |
| Return on Investment (TTM) | 19.62% |
| Earning Yield | 0.0515 |
| LT Debt / Shareholders Equity | 1.901 |
| Number of Equity Holdings | 248 |
As of September 30, 2025
Growth Metrics
| EPS Growth (1Y) | 15.51% |
| EPS Growth (3Y) | 11.21% |
| EPS Growth (5Y) | 9.24% |
| Sales Growth (1Y) | 5.42% |
| Sales Growth (3Y) | 5.58% |
| Sales Growth (5Y) | 6.53% |
| Sales per Share Growth (1Y) | 9.41% |
| Sales per Share Growth (3Y) | 7.77% |
| Operating Cash Flow - Growth Rate (3Y) | 6.37% |
As of September 30, 2025
Fund Details
Top Portfolio Holders
| Name | % Weight |
|---|---|
| Portfolio A | 5.00% |
| Portfolio B | 3.50% |
| Portfolio C | 2.25% |
Excel Add-In Codes
| Name: =YCI("M:SEVIX:DL", "name") |
| Broad Asset Class: =YCI("M:SEVIX:DL", "broad_asset_class") |
| Broad Category: =YCI("M:SEVIX:DL", "broad_category_group") |
| Prospectus Objective: =YCI("M:SEVIX:DL", "prospectus_objective") |
| To find the codes for any of our securities and financial metrics, see our Complete Excel Reference. |