

Vanguard Balanced Index Fund Investor (VBINX)
54.04
+0.16
(+0.30%)
USD |
May 22 2026
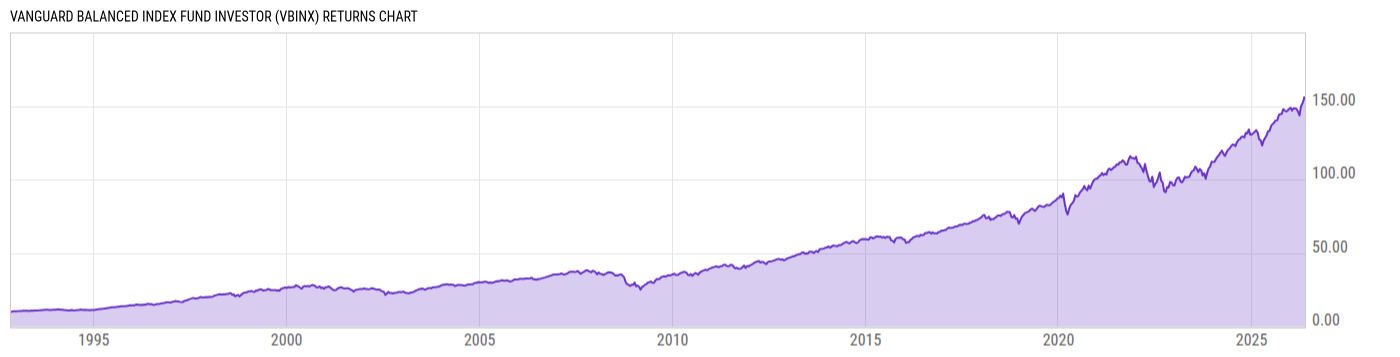
Returns Chart
Key Stats
| Net Expense Ratio | Total Assets Under Management | Weighted Average Dividend Yield | Turnover Ratio (Generic) |
|---|---|---|---|
| 0.18% | 58.85B | 1.18% | 31.00% |
| 1 Year Fund Level Flows | 1 Year Total Returns (Daily) | Annualized Total Returns Since Inception (Daily) | Max Drawdown (Since Inception) |
| -3.517B | 19.40% |
Basic Info
| Investment Strategy | |
| The Fund seeks to track, with respect to 60% of its assets, investment performance of the CRSP US Total Market Index, and with respect to 40% of its assets, investment performance of the Barclays U.S. Aggregate Float Adjusted Index. |
| General | |
| Security Type | Mutual Fund |
| Equity Style | Multi Cap Core |
| Broad Asset Class | Allocation |
| Broad Category | Allocation |
| Global Peer Group | Mixed Asset USD Aggressive |
| Peer Group | Mixed-Asset Target Alloc Growth Funds |
| Global Macro | Mixed Asset HC Aggressive |
| US Macro | Mixed-Assets Target Allocation Funds |
| YCharts Categorization | -- |
| YCharts Benchmark | -- |
| Prospectus Objective | Growth Funds |
| Fund Owner Firm Name | Vanguard |
| Broad Asset Class Benchmark Index | |
| ^SPXTR | 100.0% |
Net Fund Flows Versus Peer Group
1 Month
% Rank:
95
-3.410B
Peer Group Low
377.80M
Peer Group High
1 Year
% Rank:
97
-3.517B
-13.08B
Peer Group Low
3.508B
Peer Group High
3 Months
% Rank:
96
-4.575B
Peer Group Low
1.023B
Peer Group High
3 Years
% Rank:
97
-27.75B
Peer Group Low
5.439B
Peer Group High
6 Months
% Rank:
96
-9.226B
Peer Group Low
2.034B
Peer Group High
5 Years
% Rank:
96
-38.42B
Peer Group Low
5.439B
Peer Group High
YTD
% Rank:
95
-6.581B
Peer Group Low
1.517B
Peer Group High
10 Years
% Rank:
93
-58.34B
Peer Group Low
11.55B
Peer Group High
Date Unavailable
Risk
Performance Versus Peer Group
Annual Total Returns Versus Peers
As of May 24, 2026.
Asset Allocation
As of March 31, 2026.
| Type | % Net |
|---|---|
| Cash | -0.90% |
| Stock | 60.07% |
| Bond | 39.61% |
| Convertible | 0.00% |
| Preferred | 0.00% |
| Other | 1.21% |
Top 10 Holdings
| Name | % Weight | Price | % Change |
|---|---|---|---|
| NVIDIA Corp. | 4.15% | 215.33 | -1.90% |
| Apple, Inc. | 3.59% | 308.82 | 1.26% |
| Microsoft Corp. | 2.73% | 418.57 | -0.12% |
| Amazon.com, Inc. | 2.31% | 266.32 | -0.80% |
| Alphabet, Inc. | 2.02% | 382.97 | -1.21% |
| Broadcom Inc. | 1.78% | 414.14 | -0.10% |
| Alphabet, Inc. | 1.59% | 379.38 | -1.07% |
| Meta Platforms, Inc. | 1.21% | 610.26 | 0.47% |
| Tesla, Inc. | 0.97% | 426.01 | 1.95% |
| Eli Lilly & Co. | 0.71% | 1065.00 | 2.24% |
Fees & Availability
| Fees | |
| Actual 12B-1 Fee | -- |
| Actual Management Fee | 0.17% |
| Administration Fee | 299.0K% |
| Maximum Front Load | -- |
| Maximum Deferred Load | -- |
| Maximum Redemption Fee | -- |
| General Availability | |
| Available for Insurance Product | No |
| Available for RRSP | No |
| Purchase Details | |
| Open to New Investors | No |
| Minimum Initial Investment | 0.00 None |
| Minimum Subsequent Investment | 0.00 None |
Basic Info
| Investment Strategy | |
| The Fund seeks to track, with respect to 60% of its assets, investment performance of the CRSP US Total Market Index, and with respect to 40% of its assets, investment performance of the Barclays U.S. Aggregate Float Adjusted Index. |
| General | |
| Security Type | Mutual Fund |
| Equity Style | Multi Cap Core |
| Broad Asset Class | Allocation |
| Broad Category | Allocation |
| Global Peer Group | Mixed Asset USD Aggressive |
| Peer Group | Mixed-Asset Target Alloc Growth Funds |
| Global Macro | Mixed Asset HC Aggressive |
| US Macro | Mixed-Assets Target Allocation Funds |
| YCharts Categorization | -- |
| YCharts Benchmark | -- |
| Prospectus Objective | Growth Funds |
| Fund Owner Firm Name | Vanguard |
| Broad Asset Class Benchmark Index | |
| ^SPXTR | 100.0% |
Fundamentals
| General | |
| Distribution Yield | -- |
| Dividend Yield TTM (5-21-26) | 1.97% |
| 30-Day SEC Yield (4-30-26) | 2.28% |
| 7-Day SEC Yield | -- |
| Number of Holdings | 15970 |
| Stock | |
| Weighted Average PE Ratio | 30.83 |
| Weighted Average Price to Sales Ratio | 7.540 |
| Weighted Average Price to Book Ratio | 10.28 |
| Weighted Median ROE | 99.39% |
| Weighted Median ROA | 15.61% |
| ROI (TTM) | 22.15% |
| Return on Investment (TTM) | 22.15% |
| Earning Yield | 0.0464 |
| LT Debt / Shareholders Equity | 0.7768 |
| Number of Equity Holdings | 3115 |
| Bond | |
| Yield to Maturity (3-31-26) | 4.51% |
| Effective Duration | 5.70 |
| Average Coupon | 3.78% |
| Calculated Average Quality | 2.326 |
| Effective Maturity | 12.10 |
| Nominal Maturity | 12.15 |
| Number of Bond Holdings | 12649 |
As of March 31, 2026
Growth Metrics
| EPS Growth (1Y) | 22.95% |
| EPS Growth (3Y) | 19.07% |
| EPS Growth (5Y) | 24.51% |
| Sales Growth (1Y) | 15.09% |
| Sales Growth (3Y) | 14.86% |
| Sales Growth (5Y) | 16.04% |
| Sales per Share Growth (1Y) | 27.32% |
| Sales per Share Growth (3Y) | 15.44% |
| Operating Cash Flow - Growth Rate (3Y) | 25.88% |
As of March 31, 2026
Top Portfolio Holders
| Name | % Weight |
|---|---|
| Portfolio A | 5.00% |
| Portfolio B | 3.50% |
| Portfolio C | 2.25% |
Excel Add-In Codes
| Name: =YCI("M:VBINX", "name") |
| Broad Asset Class: =YCI("M:VBINX", "broad_asset_class") |
| Broad Category: =YCI("M:VBINX", "broad_category_group") |
| Prospectus Objective: =YCI("M:VBINX", "prospectus_objective") |
| To find the codes for any of our securities and financial metrics, see our Complete Excel Reference. |