

VALIC Company Asset Allocation Fund (VCAAX)
12.26
-0.07
(-0.57%)
USD |
Jun 03 2026
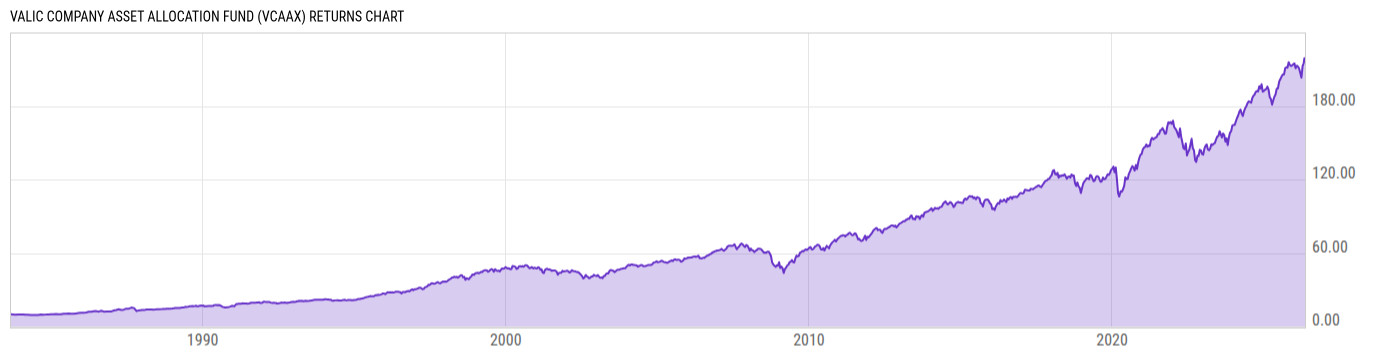
Returns Chart
Key Stats
| Net Expense Ratio | Total Assets Under Management | Weighted Average Dividend Yield | Turnover Ratio (Generic) |
|---|---|---|---|
| 0.65% | 148.81M | 1.09% | 35.00% |
| 1 Year Fund Level Flows | 1 Year Total Returns (Daily) | Annualized Total Returns Since Inception (Daily) | Max Drawdown (Since Inception) |
| -16.61M | 13.94% |
Basic Info
| Investment Strategy | |
| The Fund seeks maximum aggregate rate of return over the long-term through controlled investment risk by adjusting its investment mix among stocks, long-term debt securities and short-term money market securities. |
| General | |
| Security Type | Insurance Fund |
| Equity Style | Large Cap Core |
| Broad Asset Class | Allocation |
| Broad Category | Allocation |
| Global Peer Group | Mixed Asset USD Balanced - US |
| Peer Group | Mixed-Asset Target Alloc Moderate Funds |
| Global Macro | Mixed Asset HC Balanced |
| US Macro | Mixed-Assets Target Allocation Funds |
| YCharts Categorization | -- |
| YCharts Benchmark | -- |
| Prospectus Objective | Growth Funds |
| Fund Owner Firm Name | AIG |
| Broad Asset Class Benchmark Index | |
| ^SPXTR | 100.0% |
Net Fund Flows Versus Peer Group
1 Month
% Rank:
34
-325.86M
Peer Group Low
518.99M
Peer Group High
1 Year
% Rank:
32
-16.61M
-5.437B
Peer Group Low
642.22M
Peer Group High
3 Months
% Rank:
28
-1.193B
Peer Group Low
97.62M
Peer Group High
3 Years
% Rank:
23
-21.54B
Peer Group Low
3.106B
Peer Group High
6 Months
% Rank:
30
-3.694B
Peer Group Low
576.03M
Peer Group High
5 Years
% Rank:
27
-30.31B
Peer Group Low
2.725B
Peer Group High
YTD
% Rank:
29
-1.851B
Peer Group Low
585.46M
Peer Group High
10 Years
% Rank:
33
-51.28B
Peer Group Low
3.748B
Peer Group High
Date Unavailable
Risk
Performance Versus Peer Group
Annual Total Returns Versus Peers
As of June 04, 2026.
Asset Allocation
As of March 31, 2026.
| Type | % Net |
|---|---|
| Cash | 1.41% |
| Stock | 59.17% |
| Bond | 39.04% |
| Convertible | 0.00% |
| Preferred | 0.00% |
| Other | 0.38% |
Top 10 Holdings
| Name | % Weight | Price | % Change |
|---|---|---|---|
| NVIDIA Corp. | 5.36% | 214.75 | -3.62% |
| Apple, Inc. | 4.24% | 310.26 | -1.57% |
| Amazon.com, Inc. | 3.20% | 250.02 | -2.53% |
| Alphabet, Inc. | 2.92% | 358.99 | -0.79% |
| Microsoft Corp. | 2.30% | 427.34 | -3.17% |
| United States of America USGB 3.875 08/15/2033 FIX USD Government | 2.05% | 97.03 | -0.22% |
| Meta Platforms, Inc. | 2.04% | 622.98 | 4.24% |
| Broadcom Inc. | 1.93% | 479.23 | -0.49% |
| Wells Fargo & Co. | 1.88% | 78.68 | -0.96% |
| Mastercard, Inc. | 1.75% | 471.55 | -1.28% |
Fees & Availability
| Fees | |
| Actual 12B-1 Fee | -- |
| Actual Management Fee | 0.45% |
| Administration Fee | 99.64K% |
| Maximum Front Load | -- |
| Maximum Deferred Load | -- |
| Maximum Redemption Fee | -- |
| General Availability | |
| Available for Insurance Product |
|
| Available for RRSP | No |
| Purchase Details | |
| Open to New Investors |
|
| Minimum Initial Investment | 0.00 None |
| Minimum Subsequent Investment | 0.00 None |
Basic Info
| Investment Strategy | |
| The Fund seeks maximum aggregate rate of return over the long-term through controlled investment risk by adjusting its investment mix among stocks, long-term debt securities and short-term money market securities. |
| General | |
| Security Type | Insurance Fund |
| Equity Style | Large Cap Core |
| Broad Asset Class | Allocation |
| Broad Category | Allocation |
| Global Peer Group | Mixed Asset USD Balanced - US |
| Peer Group | Mixed-Asset Target Alloc Moderate Funds |
| Global Macro | Mixed Asset HC Balanced |
| US Macro | Mixed-Assets Target Allocation Funds |
| YCharts Categorization | -- |
| YCharts Benchmark | -- |
| Prospectus Objective | Growth Funds |
| Fund Owner Firm Name | AIG |
| Broad Asset Class Benchmark Index | |
| ^SPXTR | 100.0% |
Fundamentals
| General | |
| Distribution Yield | -- |
| Dividend Yield TTM (6-2-26) | 1.71% |
| 30-Day SEC Yield | -- |
| 7-Day SEC Yield | -- |
| Number of Holdings | 645 |
| Stock | |
| Weighted Average PE Ratio | 30.44 |
| Weighted Average Price to Sales Ratio | 7.863 |
| Weighted Average Price to Book Ratio | 10.97 |
| Weighted Median ROE | 160.3% |
| Weighted Median ROA | 19.24% |
| ROI (TTM) | 27.36% |
| Return on Investment (TTM) | 27.36% |
| Earning Yield | 0.0378 |
| LT Debt / Shareholders Equity | 0.7156 |
| Number of Equity Holdings | 55 |
| Bond | |
| Yield to Maturity (3-31-26) | 4.82% |
| Effective Duration | 7.17 |
| Average Coupon | 4.03% |
| Calculated Average Quality | 2.549 |
| Effective Maturity | 13.60 |
| Nominal Maturity | 13.62 |
| Number of Bond Holdings | 573 |
As of March 31, 2026
Growth Metrics
| EPS Growth (1Y) | 25.70% |
| EPS Growth (3Y) | 24.21% |
| EPS Growth (5Y) | 29.55% |
| Sales Growth (1Y) | 16.40% |
| Sales Growth (3Y) | 17.82% |
| Sales Growth (5Y) | 16.88% |
| Sales per Share Growth (1Y) | 17.13% |
| Sales per Share Growth (3Y) | 18.61% |
| Operating Cash Flow - Growth Rate (3Y) | 29.95% |
As of March 31, 2026
Fund Details
| Key Dates | |
| Launch Date | 9/6/1983 |
| Last Annual Report Date | 5/31/2025 |
| Last Prospectus Date | 10/1/2025 |
| Attributes | |
| Index Fund | -- |
| Inverse Fund | No |
| Leveraged Fund | -- |
| Fund of Funds | No |
| Currency Hedged Fund | -- |
| Socially Responsible Fund | No |
Top Portfolio Holders
| Name | % Weight |
|---|---|
| Portfolio A | 5.00% |
| Portfolio B | 3.50% |
| Portfolio C | 2.25% |