

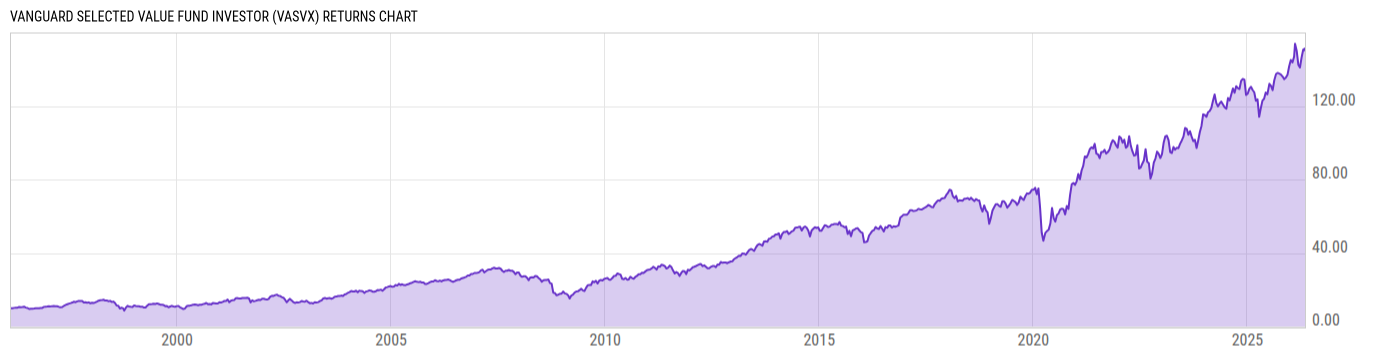
Vanguard Selected Value Fund Investor (VASVX)
28.75
-0.06
(-0.21%)
USD |
May 29 2026
Returns Chart
Key Stats
| Net Expense Ratio | Total Assets Under Management | Weighted Average Dividend Yield | Turnover Ratio (Generic) |
|---|---|---|---|
| 0.34% | 6.598B | 2.16% | 28.00% |
| 1 Year Fund Level Flows | 1 Year Total Returns (Daily) | Annualized Total Returns Since Inception (Daily) | Max Drawdown (Since Inception) |
| -752.25M | 20.58% |
Basic Info
| Investment Strategy | |
| The Fund seeks to provide long-term capital appreciation and income. Vanguard Selected Value Fund invests mainly in the stocks of mid-size U.S. companies, choosing stocks considered by an advisor to be undervalued. These stocks often have above-average dividend yields. The Fund uses multiple investment advisors. |
| General | |
| Security Type | Mutual Fund |
| Equity Style | Mid Cap Value |
| Broad Asset Class | US Equity |
| Broad Category | Equity |
| Global Peer Group | Equity US Sm&Mid Cap |
| Peer Group | Mid-Cap Value Funds |
| Global Macro | Equity North America |
| US Macro | Mid-Cap Funds |
| YCharts Categorization | -- |
| YCharts Benchmark | -- |
| Prospectus Objective | Mid-Cap Funds |
| Fund Owner Firm Name | Vanguard |
| Broad Asset Class Benchmark Index | |
| ^SPXTR | 100.0% |
Net Fund Flows Versus Peer Group
1 Month
% Rank:
85
-316.63M
Peer Group Low
387.41M
Peer Group High
1 Year
% Rank:
85
-752.25M
-3.208B
Peer Group Low
1.376B
Peer Group High
3 Months
% Rank:
85
-739.21M
Peer Group Low
809.09M
Peer Group High
3 Years
% Rank:
82
-13.16B
Peer Group Low
1.963B
Peer Group High
6 Months
% Rank:
85
-1.684B
Peer Group Low
1.140B
Peer Group High
5 Years
% Rank:
83
-19.04B
Peer Group Low
2.211B
Peer Group High
YTD
% Rank:
85
-1.007B
Peer Group Low
979.96M
Peer Group High
10 Years
% Rank:
90
-45.09B
Peer Group Low
6.216B
Peer Group High
Date Unavailable
Risk
Performance Versus Peer Group
Annual Total Returns Versus Peers
As of May 30, 2026.
Asset Allocation
As of March 31, 2026.
| Type | % Net |
|---|---|
| Cash | 0.10% |
| Stock | 95.81% |
| Bond | 0.00% |
| Convertible | 0.00% |
| Preferred | 0.00% |
| Other | 4.09% |
Top 10 Holdings
| Name | % Weight | Price | % Change |
|---|---|---|---|
|
Vanguard Market Liquidity Fund
|
4.09% | -- | -- |
| AerCap Holdings NV | 2.53% | 139.39 | 0.30% |
| Corebridge Financial, Inc. | 1.53% | 27.00 | 1.54% |
| Advance Auto Parts, Inc. | 1.45% | 60.24 | 0.63% |
| LKQ Corp. | 1.41% | 27.12 | -0.62% |
| White Mountains Insurance Group Ltd. | 1.38% | 2064.82 | -0.94% |
| Gildan Activewear, Inc. | 1.33% | 60.98 | -0.26% |
| Magna International, Inc. | 1.22% | 89.35 | -1.97% |
| Globe Life, Inc. | 1.19% | 153.24 | -0.36% |
| PPG Industries, Inc. | 1.19% | 112.98 | 0.11% |
Fees & Availability
| Fees | |
| Actual 12B-1 Fee | -- |
| Actual Management Fee | 0.41% |
| Administration Fee | 9.90M% |
| Maximum Front Load | -- |
| Maximum Deferred Load | -- |
| Maximum Redemption Fee | 0.00% |
| General Availability | |
| Available for Insurance Product | No |
| Available for RRSP | No |
| Purchase Details | |
| Open to New Investors |
|
| Minimum Initial Investment | 3000.00 None |
| Minimum Subsequent Investment | 1.00 None |
Basic Info
| Investment Strategy | |
| The Fund seeks to provide long-term capital appreciation and income. Vanguard Selected Value Fund invests mainly in the stocks of mid-size U.S. companies, choosing stocks considered by an advisor to be undervalued. These stocks often have above-average dividend yields. The Fund uses multiple investment advisors. |
| General | |
| Security Type | Mutual Fund |
| Equity Style | Mid Cap Value |
| Broad Asset Class | US Equity |
| Broad Category | Equity |
| Global Peer Group | Equity US Sm&Mid Cap |
| Peer Group | Mid-Cap Value Funds |
| Global Macro | Equity North America |
| US Macro | Mid-Cap Funds |
| YCharts Categorization | -- |
| YCharts Benchmark | -- |
| Prospectus Objective | Mid-Cap Funds |
| Fund Owner Firm Name | Vanguard |
| Broad Asset Class Benchmark Index | |
| ^SPXTR | 100.0% |
Fundamentals
| General | |
| Distribution Yield | -- |
| Dividend Yield TTM (5-28-26) | 1.98% |
| 30-Day SEC Yield (4-30-26) | 1.83% |
| 7-Day SEC Yield | -- |
| Number of Holdings | 126 |
| Stock | |
| Weighted Average PE Ratio | 22.84 |
| Weighted Average Price to Sales Ratio | 1.945 |
| Weighted Average Price to Book Ratio | 2.377 |
| Weighted Median ROE | 10.45% |
| Weighted Median ROA | 3.75% |
| ROI (TTM) | 7.84% |
| Return on Investment (TTM) | 7.84% |
| Earning Yield | 0.0695 |
| LT Debt / Shareholders Equity | 0.8095 |
| Number of Equity Holdings | 122 |
As of March 31, 2026
Growth Metrics
| EPS Growth (1Y) | 3.56% |
| EPS Growth (3Y) | -1.03% |
| EPS Growth (5Y) | 9.54% |
| Sales Growth (1Y) | 6.63% |
| Sales Growth (3Y) | 5.02% |
| Sales Growth (5Y) | 7.54% |
| Sales per Share Growth (1Y) | 9.98% |
| Sales per Share Growth (3Y) | 8.28% |
| Operating Cash Flow - Growth Rate (3Y) | 8.23% |
As of March 31, 2026
Fund Details
| Key Dates | |
| Inception Date | 2/15/1996 |
| Last Annual Report Date | 10/31/2025 |
| Last Prospectus Date | 2/28/2025 |
| Attributes | |
| Index Fund | -- |
| Inverse Fund | No |
| Leveraged Fund | -- |
| Fund of Funds | No |
| Currency Hedged Fund | -- |
| Socially Responsible Fund | No |
Top Portfolio Holders
| Name | % Weight |
|---|---|
| Portfolio A | 5.00% |
| Portfolio B | 3.50% |
| Portfolio C | 2.25% |
Excel Add-In Codes
| Name: =YCI("M:VASVX", "name") |
| Broad Asset Class: =YCI("M:VASVX", "broad_asset_class") |
| Broad Category: =YCI("M:VASVX", "broad_category_group") |
| Prospectus Objective: =YCI("M:VASVX", "prospectus_objective") |
| To find the codes for any of our securities and financial metrics, see our Complete Excel Reference. |