

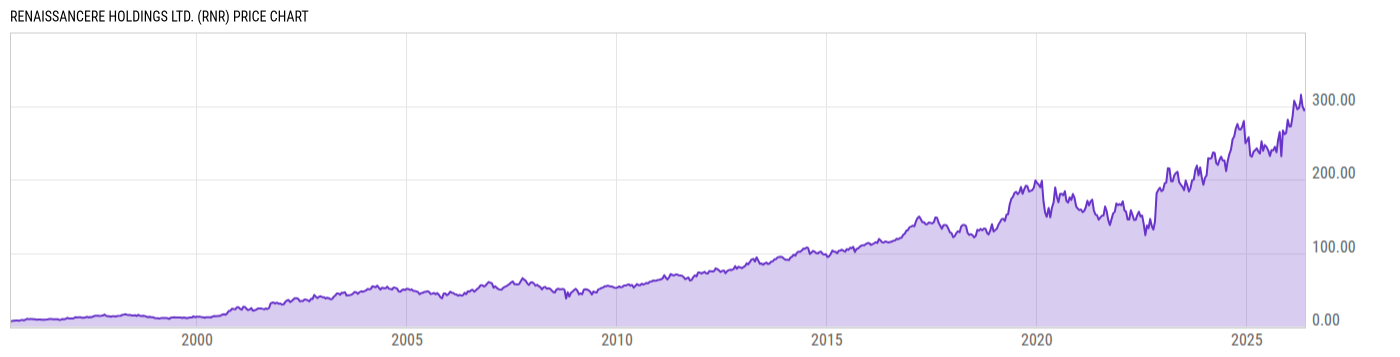
RenaissanceRe Holdings Ltd. (RNR)
277.78
-2.83
(-1.01%)
USD |
NYSE |
Jun 04, 16:00
277.78
0.00 (0.00%)
After-Hours: 20:00
Price Chart
Key Stats
| Price and Performance | |
|---|---|
| Market Cap | 11.94B |
| 52 Week High (Daily) | |
| 52 Week Low (Daily) | |
| All-Time High (Daily) | |
| Year to Date Total Returns (Daily) | |
| 1 Month Total Returns (Daily) | |
| 1 Year Total Returns (Daily) | 12.52% |
| Valuation | |
| PE Ratio | 4.636 |
| PE Ratio (Forward) | |
| PS Ratio | 1.087 |
| Price to Book Value | 1.109 |
| EV to EBITDA | |
| Dividend | |
|---|---|
| Dividend | 0.41 |
| Dividend Yield (Forward) | |
| Financials | |
| Revenue (5 Year Growth) | |
| Revenue (Quarterly YoY Growth) | |
| EPS Diluted (5 Year Growth) | |
| EPS Diluted (Quarterly YoY Growth) | |
| Debt to Equity Ratio | 0.2024 |
| Return on Equity | |
| Return on Assets | |
| Risk | |
| Beta (5Y) | |
| Max Drawdown (5Y) | 37.11% |
Profile
| RenaissanceRe Holdings Ltd. engages in the provision of reinsurance and insurance services. It operates through the following segments: Property, Casualty and Specialty, and Other. The Property segment focuses on catastrophe and other property reinsurance and insurance. The Casualty and Specialty segment deals with casualty and specialty reinsurance and insurance. The Other segment includes investments unit, strategic investments, corporate expense, capital servicing costs, non-controlling interests, and certain expenses related to acquisitions and dispositions. The company was founded by Neill Alexander Currie on June 7, 1993, and is headquartered in Pembroke, Bermuda. |
| URL | http://www.renre.com |
| Investor Relations URL | https://investor.renre.com/ |
| HQ State/Province | Hamilton |
| Sector | Financials |
| Industry | Insurance |
| Next Earnings Release | Jul. 29, 2026 (est.) |
| Last Earnings Release | Apr. 28, 2026 |
| Next Ex-Dividend Date | Jun. 15, 2026 |
| Last Ex-Dividend Date | Mar. 13, 2026 |