

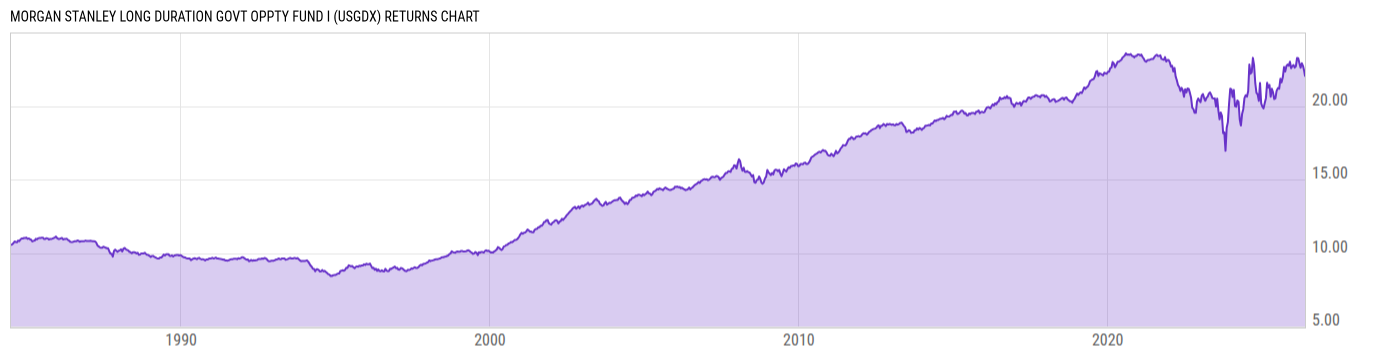
Morgan Stanley Long Duration Govt Oppty Fund I (USGDX)
6.68
+0.01
(+0.15%)
USD |
May 22 2026
Returns Chart
Key Stats
| Net Expense Ratio | Total Assets Under Management | Weighted Average Dividend Yield | Turnover Ratio (Generic) |
|---|---|---|---|
| 0.50% | 218.59M | -- | 349.0% |
| 1 Year Fund Level Flows | 1 Year Total Returns (Daily) | Annualized Total Returns Since Inception (Daily) | Max Drawdown (Since Inception) |
| 4.004M | 8.29% |
Basic Info
| Investment Strategy | |
| The Fund seeks a high level of current income consistent with safety of principal. The Fund invests at least 80% of its net assets in a portfolio of U.S. government securities. It may invest in zero coupon securities, which are purchased at a discount and generally accrue interest, but make no payment until maturity. |
| General | |
| Security Type | Mutual Fund |
| Equity Style | -- |
| Broad Asset Class | Taxable Bond |
| Broad Category | Fixed Income |
| Global Peer Group | Bond USD Government |
| Peer Group | General U.S. Government Funds |
| Global Macro | Bond Government |
| US Macro | U.S. Government & Treasury Fixed Income Funds |
| YCharts Categorization | -- |
| YCharts Benchmark | -- |
| Prospectus Objective | General U.S. Government Funds |
| Fund Owner Firm Name | Morgan Stanley |
| Broad Asset Class Benchmark Index | |
| ^BBUSATR | 100.0% |
Net Fund Flows Versus Peer Group
1 Month
% Rank:
49
-37.92M
Peer Group Low
669.36M
Peer Group High
1 Year
% Rank:
31
4.004M
-553.03M
Peer Group Low
1.050B
Peer Group High
3 Months
% Rank:
26
-203.81M
Peer Group Low
9.948M
Peer Group High
3 Years
% Rank:
43
-2.253B
Peer Group Low
2.369B
Peer Group High
6 Months
% Rank:
35
-239.35M
Peer Group Low
153.57M
Peer Group High
5 Years
% Rank:
55
-2.067B
Peer Group Low
3.118B
Peer Group High
YTD
% Rank:
34
-153.55M
Peer Group Low
155.75M
Peer Group High
10 Years
% Rank:
79
-3.426B
Peer Group Low
13.79B
Peer Group High
Date Unavailable
Risk
Performance Versus Peer Group
Annual Total Returns Versus Peers
As of May 26, 2026.
Asset Allocation
As of March 31, 2026.
| Type | % Net |
|---|---|
| Cash | 0.65% |
| Stock | 0.00% |
| Bond | 100.2% |
| Convertible | 0.00% |
| Preferred | 0.00% |
| Other | -0.80% |
Top 10 Holdings
| Name | % Weight | Price | % Change |
|---|---|---|---|
|
10Y TNotes JUN26
|
37.32% | -- | -- |
|
2YR T-NOTE JUN26
|
26.05% | -- | -- |
|
10YR UL TN JUN26
|
20.13% | -- | -- |
|
Federal National Mortgage Association 5% 01-APR-2056
|
10.68% | -- | -- |
|
GOVERNMENT NATIONAL MORTGAGE ASSOCIATION 2399A AL SEQ FIX 6% 20-JUL-2053
|
5.26% | -- | -- |
|
GOVERNMENT NATIONAL MORTGAGE ASSOCIATION 2384B MW SEQ FIX 6% 20-JUN-2053
|
4.48% | -- | -- |
| FHLMC-New 6.0 07/25/2053 FIX USD Agency | 4.36% | 101.68 | 0.44% |
|
Federal National Mortgage Association 4.5% 01-APR-2056
|
4.27% | -- | -- |
|
Federal National Mortgage Association 5.5% 01-APR-2056
|
4.04% | -- | -- |
|
GOVERNMENT NATIONAL MORTGAGE ASSOCIATION 23165B EY SEQ FIX 6.5% 20-NOV-2053
|
3.73% | -- | -- |
Fees & Availability
| Fees | |
| Actual 12B-1 Fee | -- |
| Actual Management Fee | 0.09% |
| Administration Fee | 50.12K% |
| Maximum Front Load | -- |
| Maximum Deferred Load | -- |
| Maximum Redemption Fee | 0.00% |
| General Availability | |
| Available for Insurance Product | No |
| Available for RRSP | No |
| Purchase Details | |
| Open to New Investors |
|
| Minimum Initial Investment | 1.00M None |
| Minimum Subsequent Investment | 0.00 None |
Basic Info
| Investment Strategy | |
| The Fund seeks a high level of current income consistent with safety of principal. The Fund invests at least 80% of its net assets in a portfolio of U.S. government securities. It may invest in zero coupon securities, which are purchased at a discount and generally accrue interest, but make no payment until maturity. |
| General | |
| Security Type | Mutual Fund |
| Equity Style | -- |
| Broad Asset Class | Taxable Bond |
| Broad Category | Fixed Income |
| Global Peer Group | Bond USD Government |
| Peer Group | General U.S. Government Funds |
| Global Macro | Bond Government |
| US Macro | U.S. Government & Treasury Fixed Income Funds |
| YCharts Categorization | -- |
| YCharts Benchmark | -- |
| Prospectus Objective | General U.S. Government Funds |
| Fund Owner Firm Name | Morgan Stanley |
| Broad Asset Class Benchmark Index | |
| ^BBUSATR | 100.0% |
Fundamentals
| General | |
| Distribution Yield | -- |
| Dividend Yield TTM (5-21-26) | 5.60% |
| 30-Day SEC Yield (3-31-26) | 5.47% |
| 7-Day SEC Yield | -- |
| Number of Holdings | 180 |
| Bond | |
| Yield to Maturity (3-31-26) | 5.60% |
| Effective Duration | -- |
| Average Coupon | 6.21% |
| Calculated Average Quality | 1.239 |
| Effective Maturity | 27.76 |
| Nominal Maturity | 27.76 |
| Number of Bond Holdings | 167 |
As of March 31, 2026
Fund Details
Top Portfolio Holders
| Name | % Weight |
|---|---|
| Portfolio A | 5.00% |
| Portfolio B | 3.50% |
| Portfolio C | 2.25% |
Excel Add-In Codes
| Name: =YCI("M:USGDX", "name") |
| Broad Asset Class: =YCI("M:USGDX", "broad_asset_class") |
| Broad Category: =YCI("M:USGDX", "broad_category_group") |
| Prospectus Objective: =YCI("M:USGDX", "prospectus_objective") |
| To find the codes for any of our securities and financial metrics, see our Complete Excel Reference. |