

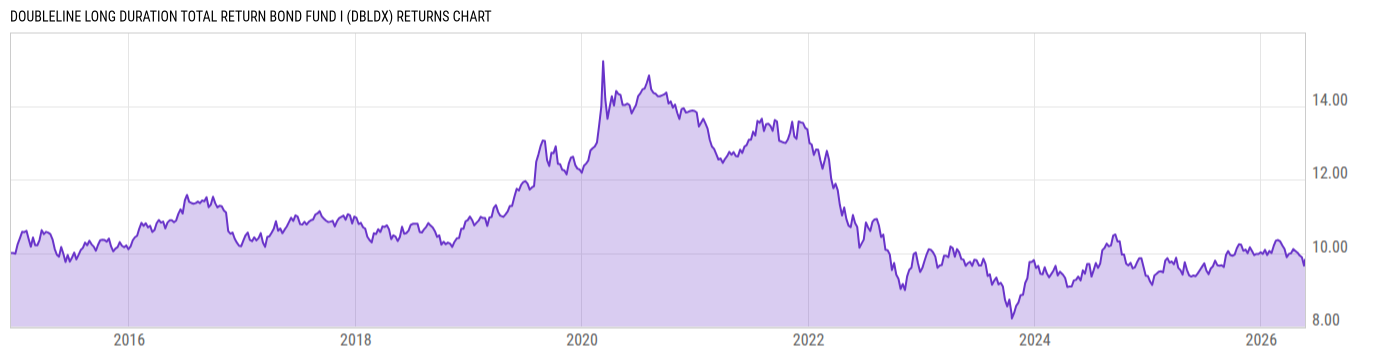
DoubleLine Long Duration Total Return Bond Fund I (DBLDX)
6.07
+0.02
(+0.33%)
USD |
May 22 2026
Returns Chart
Key Stats
| Net Expense Ratio | Total Assets Under Management | Weighted Average Dividend Yield | Turnover Ratio (Generic) |
|---|---|---|---|
| 0.51% | 61.06M | -- | 86.00% |
| 1 Year Fund Level Flows | 1 Year Total Returns (Daily) | Annualized Total Returns Since Inception (Daily) | Max Drawdown (Since Inception) |
| -5.793M | 5.94% |
Basic Info
| Investment Strategy | |
| The Fund seeks to provide long-term total return. The Fund seeks current income by investing principally in debt securities of any kind. Under normal circumstances, the Adviser expects to construct an investment portfolio for the Fund with a dollar-weighted average effective duration of at least 10 years. |
| General | |
| Security Type | Mutual Fund |
| Equity Style | -- |
| Broad Asset Class | Taxable Bond |
| Broad Category | Fixed Income |
| Global Peer Group | Bond USD Corporates |
| Peer Group | Corporate Debt Funds BBB-Rated |
| Global Macro | Bond Corporates |
| US Macro | General Domestic Taxable Fixed Income Funds |
| YCharts Categorization | -- |
| YCharts Benchmark | -- |
| Prospectus Objective | Corporate Debt Funds BBB-Rated |
| Fund Owner Firm Name | DoubleLine Funds |
| Broad Asset Class Benchmark Index | |
| ^BBUSATR | 100.0% |
Net Fund Flows Versus Peer Group
1 Month
% Rank:
69
-1.147B
Peer Group Low
1.940B
Peer Group High
1 Year
% Rank:
61
-5.793M
-4.685B
Peer Group Low
13.40B
Peer Group High
3 Months
% Rank:
67
-357.27M
Peer Group Low
3.527B
Peer Group High
3 Years
% Rank:
54
-8.057B
Peer Group Low
24.97B
Peer Group High
6 Months
% Rank:
57
-1.778B
Peer Group Low
9.539B
Peer Group High
5 Years
% Rank:
56
-9.856B
Peer Group Low
27.17B
Peer Group High
YTD
% Rank:
56
-451.42M
Peer Group Low
7.193B
Peer Group High
10 Years
% Rank:
77
-7.443B
Peer Group Low
63.14B
Peer Group High
Date Unavailable
Risk
Performance Versus Peer Group
Annual Total Returns Versus Peers
As of May 26, 2026.
Asset Allocation
As of February 28, 2026.
| Type | % Net |
|---|---|
| Cash | 3.52% |
| Stock | 0.00% |
| Bond | 95.10% |
| Convertible | 0.00% |
| Preferred | 0.00% |
| Other | 1.37% |
Top 10 Holdings
| Name | % Weight | Price | % Change |
|---|---|---|---|
|
GOVERNMENT NATIONAL MORTGAGE ASSOCIATION 1579C VZ SEQ FIX 2.5% 20-MAY-2045
|
5.92% | -- | -- |
| FNMA-New 07/25/2040 FIX USD Agency | 5.50% | -- | -- |
| FHLMC-New 2.0 12/25/2045 FIX USD Agency | 3.08% | 81.23 | 0.21% |
|
Federal National Mortgage Association 01-JAN-2052 FS0176
|
2.94% | -- | -- |
|
FEDERAL NATIONAL MORTGAGE ASSOCIATION 1442C BZ SEQ FIX 3% 25-JUL-2044
|
2.78% | -- | -- |
| FHLMC-New 2.5 10/25/2050 FIX USD Agency | 2.78% | 85.21 | 0.55% |
|
GOVERNMENT NATIONAL MORTGAGE ASSOCIATION 229G MZ SUP FIX 3.5% 20-JAN-2052
|
2.76% | -- | -- |
| FNMA-New 08/25/2051 FIX USD Agency | 2.53% | -- | -- |
|
Federal National Mortgage Association 01-MAR-2044 310233
|
2.41% | -- | -- |
|
Federal Home Loan Mortgage Corp 01-MAR-2052 SD7553
|
2.33% | -- | -- |
Fees & Availability
| Fees | |
| Actual 12B-1 Fee | -- |
| Actual Management Fee | 0.08% |
| Administration Fee | 30.04K% |
| Maximum Front Load | -- |
| Maximum Deferred Load | -- |
| Maximum Redemption Fee | -- |
| General Availability | |
| Available for Insurance Product | No |
| Available for RRSP | No |
| Purchase Details | |
| Open to New Investors |
|
| Minimum Initial Investment | 100000.0 None |
| Minimum Subsequent Investment | 100.00 None |
Basic Info
| Investment Strategy | |
| The Fund seeks to provide long-term total return. The Fund seeks current income by investing principally in debt securities of any kind. Under normal circumstances, the Adviser expects to construct an investment portfolio for the Fund with a dollar-weighted average effective duration of at least 10 years. |
| General | |
| Security Type | Mutual Fund |
| Equity Style | -- |
| Broad Asset Class | Taxable Bond |
| Broad Category | Fixed Income |
| Global Peer Group | Bond USD Corporates |
| Peer Group | Corporate Debt Funds BBB-Rated |
| Global Macro | Bond Corporates |
| US Macro | General Domestic Taxable Fixed Income Funds |
| YCharts Categorization | -- |
| YCharts Benchmark | -- |
| Prospectus Objective | Corporate Debt Funds BBB-Rated |
| Fund Owner Firm Name | DoubleLine Funds |
| Broad Asset Class Benchmark Index | |
| ^BBUSATR | 100.0% |
Fundamentals
| General | |
| Distribution Yield | -- |
| Dividend Yield TTM (5-21-26) | 5.47% |
| 30-Day SEC Yield (4-30-26) | 4.70% |
| 7-Day SEC Yield | -- |
| Number of Holdings | 62 |
| Bond | |
| Yield to Maturity (2-28-26) | 4.57% |
| Effective Duration | 14.22 |
| Average Coupon | 2.86% |
| Calculated Average Quality | 1.00 |
| Effective Maturity | 23.63 |
| Nominal Maturity | 23.63 |
| Number of Bond Holdings | 49 |
As of February 28, 2026
Fund Details
Top Portfolio Holders
| Name | % Weight |
|---|---|
| Portfolio A | 5.00% |
| Portfolio B | 3.50% |
| Portfolio C | 2.25% |
Excel Add-In Codes
| Name: =YCI("M:DBLDX", "name") |
| Broad Asset Class: =YCI("M:DBLDX", "broad_asset_class") |
| Broad Category: =YCI("M:DBLDX", "broad_category_group") |
| Prospectus Objective: =YCI("M:DBLDX", "prospectus_objective") |
| To find the codes for any of our securities and financial metrics, see our Complete Excel Reference. |