

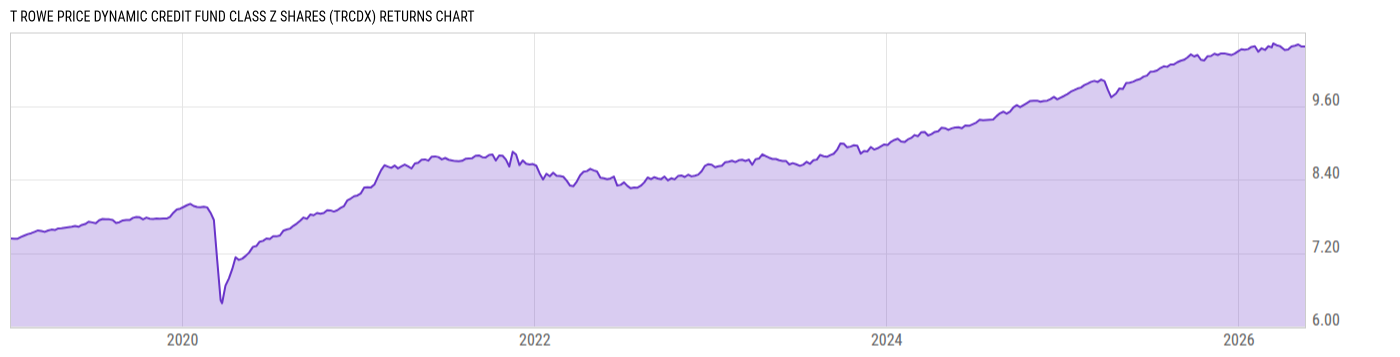
T Rowe Price Dynamic Credit Fund Class Z Shares (TRCDX)
8.57
0.00 (0.00%)
USD |
Jun 08 2026
Returns Chart
Key Stats
| Net Expense Ratio | Total Assets Under Management | Weighted Average Dividend Yield | Turnover Ratio (Generic) |
|---|---|---|---|
| 0.01% | 1.394B | -- | 130.0% |
| 1 Year Fund Level Flows | 1 Year Total Returns (Daily) | Annualized Total Returns Since Inception (Daily) | Max Drawdown (Since Inception) |
| 243.55M | 5.18% |
Basic Info
| Investment Strategy | |
| The Fund seeks total return through a combination of income and capital appreciation. The fund normally invests at least 80% of its net assets (including any borrowings for investment purposes) in credit instruments and derivative instruments that are linked to, or provide investment exposure to, credit instruments. |
| General | |
| Security Type | Mutual Fund |
| Equity Style | -- |
| Broad Asset Class | Taxable Bond |
| Broad Category | Alternative Strategies |
| Global Peer Group | Alternative Credit Focus |
| Peer Group | Alternative Credit Focus Funds |
| Global Macro | Alternative Bond |
| US Macro | Alternative Bond Funds |
| YCharts Categorization | -- |
| YCharts Benchmark | -- |
| Prospectus Objective | Alternative Credit Focus Funds |
| Fund Owner Firm Name | T. Rowe Price |
| Broad Asset Class Benchmark Index | |
| ^BBUSATR | 100.0% |
Net Fund Flows Versus Peer Group
1 Month
% Rank:
8
-11.14M
Peer Group Low
168.46M
Peer Group High
1 Year
% Rank:
22
243.55M
-914.98M
Peer Group Low
3.343B
Peer Group High
3 Months
% Rank:
12
-264.79M
Peer Group Low
869.06M
Peer Group High
3 Years
% Rank:
14
-703.80M
Peer Group Low
4.117B
Peer Group High
6 Months
% Rank:
22
-407.31M
Peer Group Low
2.256B
Peer Group High
5 Years
% Rank:
14
-1.870B
Peer Group Low
2.716B
Peer Group High
YTD
% Rank:
12
-301.59M
Peer Group Low
2.047B
Peer Group High
10 Years
% Rank:
17
-11.22B
Peer Group Low
6.503B
Peer Group High
Date Unavailable
Risk
Performance Versus Peer Group
Annual Total Returns Versus Peers
As of June 09, 2026.
Asset Allocation
As of March 31, 2026.
| Type | % Net |
|---|---|
| Cash | 7.62% |
| Stock | 0.65% |
| Bond | 88.99% |
| Convertible | 0.00% |
| Preferred | 1.66% |
| Other | 1.08% |
Top 10 Holdings
| Name | % Weight | Price | % Change |
|---|---|---|---|
|
Interest Rate Swap General Security
|
26.48% | -- | -- |
|
Credit Default Swap Index Investment Grade Ser 46 5 Yrs
|
20.41% | -- | -- |
| T Rowe Price Government Money Fund | 9.54% | 1.00 | 0.00% |
| United States of America USGB 04/23/2026 FIX USD Government (Matured) | 9.51% | 100.00 | 0.01% |
|
Oracle Corp Credit Default Swap
|
4.70% | -- | -- |
|
MSCI US Quality Index TRS
|
2.77% | -- | -- |
| DIRECTV FINANCING, LLC DIRFIN 10.0 02/15/2031 FIX USD Corporate 144A | 2.03% | 103.60 | -0.02% |
| PUERTO RICO COMWLTH PR 0.000 11/01/2043 | 1.94% | 69.62 | 0.00% |
|
Vantor Inc 03-MAR-2033 Term Loan B
|
1.92% | -- | -- |
| BEIGNET INVESTOR LLC BEIGINV 6.581 05/30/2049 FIX USD Corporate 144A | 1.90% | 101.69 | 0.07% |
Fees & Availability
| Fees | |
| Actual 12B-1 Fee | -- |
| Actual Management Fee | 0.00% |
| Administration Fee | -- |
| Maximum Front Load | 0.00% |
| Maximum Deferred Load | -- |
| Maximum Redemption Fee | 0.00% |
| General Availability | |
| Available for Insurance Product | No |
| Available for RRSP | No |
| Purchase Details | |
| Open to New Investors |
|
| Minimum Initial Investment | 0.00 None |
| Minimum Subsequent Investment | 0.00 None |
Basic Info
| Investment Strategy | |
| The Fund seeks total return through a combination of income and capital appreciation. The fund normally invests at least 80% of its net assets (including any borrowings for investment purposes) in credit instruments and derivative instruments that are linked to, or provide investment exposure to, credit instruments. |
| General | |
| Security Type | Mutual Fund |
| Equity Style | -- |
| Broad Asset Class | Taxable Bond |
| Broad Category | Alternative Strategies |
| Global Peer Group | Alternative Credit Focus |
| Peer Group | Alternative Credit Focus Funds |
| Global Macro | Alternative Bond |
| US Macro | Alternative Bond Funds |
| YCharts Categorization | -- |
| YCharts Benchmark | -- |
| Prospectus Objective | Alternative Credit Focus Funds |
| Fund Owner Firm Name | T. Rowe Price |
| Broad Asset Class Benchmark Index | |
| ^BBUSATR | 100.0% |
Fundamentals
| General | |
| Distribution Yield | -- |
| Dividend Yield TTM (6-5-26) | 7.98% |
| 30-Day SEC Yield (4-30-26) | 7.00% |
| 7-Day SEC Yield | -- |
| Number of Holdings | 246 |
| Bond | |
| Yield to Maturity (3-31-26) | 7.23% |
| Effective Duration | -0.77 |
| Average Coupon | 7.98% |
| Calculated Average Quality | 5.631 |
| Effective Maturity | 6.519 |
| Nominal Maturity | 6.694 |
| Number of Bond Holdings | 159 |
As of March 31, 2026
Fund Details
Top Portfolio Holders
| Name | % Weight |
|---|---|
| Portfolio A | 5.00% |
| Portfolio B | 3.50% |
| Portfolio C | 2.25% |
Excel Add-In Codes
| Name: =YCI("M:TRCDX", "name") |
| Broad Asset Class: =YCI("M:TRCDX", "broad_asset_class") |
| Broad Category: =YCI("M:TRCDX", "broad_category_group") |
| Prospectus Objective: =YCI("M:TRCDX", "prospectus_objective") |
| To find the codes for any of our securities and financial metrics, see our Complete Excel Reference. |