

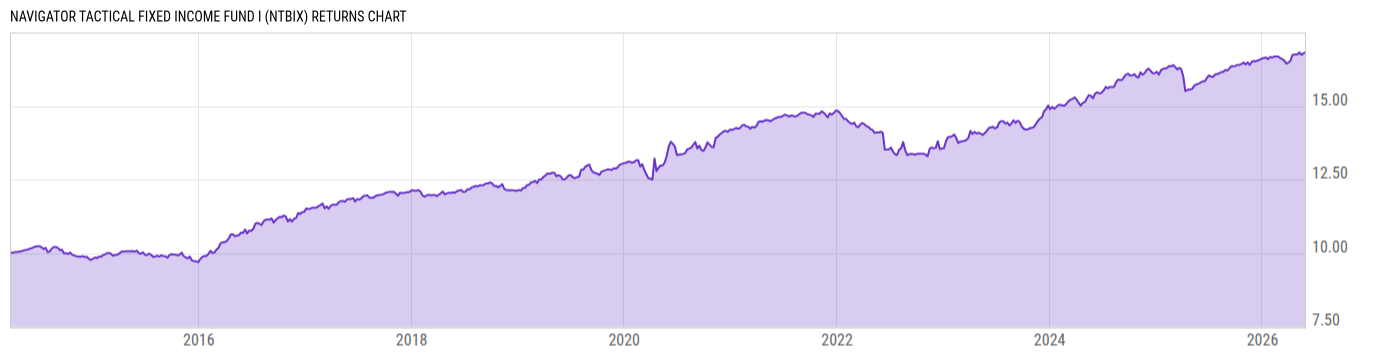
Navigator Tactical Fixed Income Fund I (NTBIX)
9.74
0.00 (0.00%)
USD |
May 27 2026
Returns Chart
Key Stats
| Net Expense Ratio | Total Assets Under Management | Weighted Average Dividend Yield | Turnover Ratio (Generic) |
|---|---|---|---|
| 0.96% | 7.228B | -- | 44.00% |
| 1 Year Fund Level Flows | 1 Year Total Returns (Daily) | Annualized Total Returns Since Inception (Daily) | Max Drawdown (Since Inception) |
| -883.73M | 6.77% |
Basic Info
| Investment Strategy | |
| The Fund seeks total return. Secondarily, current income. The Fund invests at least 80% of its net assets in long and/or short positions in fixed income securities. It strategy is driven by a modeling process which measures the relative strength or momentum of various fixed income assets classes against one another. |
| General | |
| Security Type | Mutual Fund |
| Equity Style | -- |
| Broad Asset Class | Taxable Bond |
| Broad Category | Alternative Strategies |
| Global Peer Group | Alternative Credit Focus |
| Peer Group | Alternative Credit Focus Funds |
| Global Macro | Alternative Bond |
| US Macro | Alternative Bond Funds |
| YCharts Categorization | -- |
| YCharts Benchmark | -- |
| Prospectus Objective | Alternative Credit Focus Funds |
| Fund Owner Firm Name | Navigator |
| Broad Asset Class Benchmark Index | |
| ^BBUSATR | 100.0% |
Net Fund Flows Versus Peer Group
1 Month
% Rank:
99
-137.10M
Peer Group Low
639.74M
Peer Group High
1 Year
% Rank:
99
-883.73M
-883.73M
Peer Group Low
3.386B
Peer Group High
3 Months
% Rank:
99
-251.93M
Peer Group Low
1.370B
Peer Group High
3 Years
% Rank:
92
-718.77M
Peer Group Low
2.547B
Peer Group High
6 Months
% Rank:
99
-479.25M
Peer Group Low
2.318B
Peer Group High
5 Years
% Rank:
92
-1.869B
Peer Group Low
2.593B
Peer Group High
YTD
% Rank:
99
-323.16M
Peer Group Low
1.964B
Peer Group High
10 Years
% Rank:
8
-12.03B
Peer Group Low
6.106B
Peer Group High
Date Unavailable
Risk
Performance Versus Peer Group
Annual Total Returns Versus Peers
As of May 28, 2026.
Asset Allocation
As of March 31, 2026.
| Type | % Net |
|---|---|
| Cash | 2.61% |
| Stock | 0.05% |
| Bond | 96.68% |
| Convertible | 0.00% |
| Preferred | 0.00% |
| Other | 0.66% |
Top 10 Holdings
| Name | % Weight | Price | % Change |
|---|---|---|---|
| iShares iBoxx $ High Yield Corporate Bond ETF | 9.96% | 80.13 | -0.06% |
| Dreyfus Treasury Obligations Cash Management Inst | 5.12% | 1.00 | 0.00% |
| United States of America USGB 4.125 10/31/2029 FIX USD Government | 4.21% | 100.00 | 0.02% |
| United States of America USGB 04/02/2026 FIX USD Government (Matured) | 2.09% | 100.00 | 0.01% |
| United States of America USGB 04/09/2026 FIX USD Government (Matured) | 2.08% | 100.00 | 0.01% |
| United States of America USGB 04/16/2026 FIX USD Government (Matured) | 2.08% | 100.00 | 0.01% |
| United States of America USGB 04/23/2026 FIX USD Government (Matured) | 2.08% | 100.00 | 0.01% |
| United States of America USGB 04/30/2026 FIX USD Government (Matured) | 2.08% | 100.00 | 0.01% |
| United States of America USGB 05/07/2026 FIX USD Government (Matured) | 2.08% | 100.00 | 0.02% |
| United States of America USGB 05/14/2026 FIX USD Government (Matured) | 2.08% | 100.00 | 0.01% |
Fees & Availability
| Fees | |
| Actual 12B-1 Fee | -- |
| Actual Management Fee | 0.80% |
| Administration Fee | 1.20M% |
| Maximum Front Load | -- |
| Maximum Deferred Load | -- |
| Maximum Redemption Fee | -- |
| General Availability | |
| Available for Insurance Product | No |
| Available for RRSP | No |
| Purchase Details | |
| Open to New Investors |
|
| Minimum Initial Investment | 25000.00 None |
| Minimum Subsequent Investment | 0.00 None |
Basic Info
| Investment Strategy | |
| The Fund seeks total return. Secondarily, current income. The Fund invests at least 80% of its net assets in long and/or short positions in fixed income securities. It strategy is driven by a modeling process which measures the relative strength or momentum of various fixed income assets classes against one another. |
| General | |
| Security Type | Mutual Fund |
| Equity Style | -- |
| Broad Asset Class | Taxable Bond |
| Broad Category | Alternative Strategies |
| Global Peer Group | Alternative Credit Focus |
| Peer Group | Alternative Credit Focus Funds |
| Global Macro | Alternative Bond |
| US Macro | Alternative Bond Funds |
| YCharts Categorization | -- |
| YCharts Benchmark | -- |
| Prospectus Objective | Alternative Credit Focus Funds |
| Fund Owner Firm Name | Navigator |
| Broad Asset Class Benchmark Index | |
| ^BBUSATR | 100.0% |
Fundamentals
| General | |
| Distribution Yield | -- |
| Dividend Yield TTM (5-26-26) | 4.55% |
| 30-Day SEC Yield (8-31-15) | 2.13% |
| 7-Day SEC Yield | -- |
| Number of Holdings | 124 |
| Bond | |
| Yield to Maturity (3-31-26) | 4.39% |
| Effective Duration | -- |
| Average Coupon | 4.24% |
| Calculated Average Quality | 3.582 |
| Effective Maturity | 1.187 |
| Nominal Maturity | 1.290 |
| Number of Bond Holdings | 113 |
As of March 31, 2026
Fund Details
Top Portfolio Holders
| Name | % Weight |
|---|---|
| Portfolio A | 5.00% |
| Portfolio B | 3.50% |
| Portfolio C | 2.25% |
Excel Add-In Codes
| Name: =YCI("M:NTBIX", "name") |
| Broad Asset Class: =YCI("M:NTBIX", "broad_asset_class") |
| Broad Category: =YCI("M:NTBIX", "broad_category_group") |
| Prospectus Objective: =YCI("M:NTBIX", "prospectus_objective") |
| To find the codes for any of our securities and financial metrics, see our Complete Excel Reference. |