

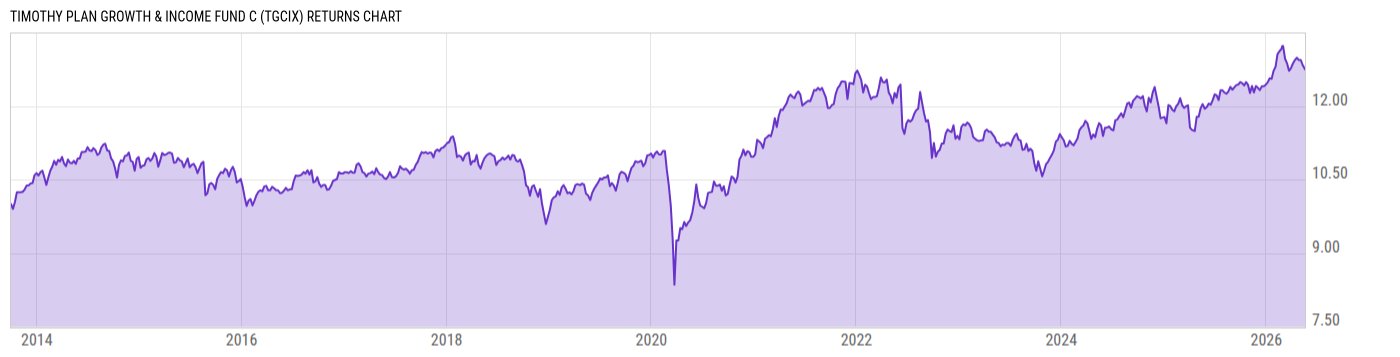
Timothy Plan Growth & Income Fund C (TGCIX)
10.94
+0.07
(+0.64%)
USD |
Jun 09 2026
Returns Chart
Key Stats
| Net Expense Ratio | Total Assets Under Management | Weighted Average Dividend Yield | Turnover Ratio (Generic) |
|---|---|---|---|
| 2.59% | 19.02M | -- | 67.00% |
| 1 Year Fund Level Flows | 1 Year Total Returns (Daily) | Annualized Total Returns Since Inception (Daily) | Max Drawdown (Since Inception) |
| -924690.0 | 7.30% |
Basic Info
| Investment Strategy | |
| The Fund seeks total return through a combination of growth and income and preservation of capital in declining markets. Under normal circumstances, the Fund invests primarily in equity securities of foreign and domestic companies that the Advisor believes are undervalued, and in fixed income securities. |
| General | |
| Security Type | Mutual Fund |
| Equity Style | -- |
| Broad Asset Class | Allocation |
| Broad Category | Allocation |
| Global Peer Group | Mixed Asset USD Balanced - Global |
| Peer Group | Mixed-Asset Target Alloc Moderate Funds |
| Global Macro | Mixed Asset HC Balanced |
| US Macro | Mixed-Assets Target Allocation Funds |
| YCharts Categorization | -- |
| YCharts Benchmark | -- |
| Prospectus Objective | Growth Funds |
| Fund Owner Firm Name | Timothy Plan |
| Broad Asset Class Benchmark Index | |
| ^SPXTR | 100.0% |
Net Fund Flows Versus Peer Group
1 Month
% Rank:
17
-365.62M
Peer Group Low
32.29M
Peer Group High
1 Year
% Rank:
20
-924690.0
-5.510B
Peer Group Low
642.22M
Peer Group High
3 Months
% Rank:
18
-1.193B
Peer Group Low
97.62M
Peer Group High
3 Years
% Rank:
14
-21.36B
Peer Group Low
3.106B
Peer Group High
6 Months
% Rank:
22
-3.729B
Peer Group Low
576.03M
Peer Group High
5 Years
% Rank:
16
-30.46B
Peer Group Low
2.725B
Peer Group High
YTD
% Rank:
20
-1.851B
Peer Group Low
585.46M
Peer Group High
10 Years
% Rank:
25
-51.73B
Peer Group Low
3.718B
Peer Group High
Date Unavailable
Risk
Performance Versus Peer Group
Annual Total Returns Versus Peers
As of June 10, 2026.
Asset Allocation
As of March 31, 2026.
| Type | % Net |
|---|---|
| Cash | 0.32% |
| Stock | 55.26% |
| Bond | 44.07% |
| Convertible | 0.00% |
| Preferred | 0.00% |
| Other | 0.35% |
Top 10 Holdings
| Name | % Weight | Price | % Change |
|---|---|---|---|
| Timothy Plan High Dividend Stock ETF | 55.46% | 41.79 | 0.84% |
| United States of America USGB 4.75 08/15/2055 FIX USD Government | 3.78% | 95.92 | 0.55% |
| United States of America USGB 4.25 08/15/2035 FIX USD Government | 2.86% | 98.10 | 0.28% |
| United States of America USGB 4.625 04/30/2031 FIX USD Government | 2.27% | 101.57 | 0.15% |
| United States of America USGB 4.5 02/15/2044 FIX USD Government | 1.61% | 94.30 | 0.48% |
| State of Israel ISRAEL 5.5 03/12/2034 FIX USD Sovereign | 1.07% | 101.30 | 0.05% |
|
JOHN DEERE OWNER TRUST 2025 A3 SEQ FIX 4.23% 17-SEP-2029
|
0.95% | -- | -- |
|
Federal National Mortgage Association 01-AUG-2052 BV8017
|
0.76% | -- | -- |
|
KUBOTA CREDIT OWNER TRUST 252 A3 FIX 4.42% 17-SEP-2029
|
0.71% | -- | -- |
| Province of Ontario ONT 04/27/2026 FIX USD Sovereign (Matured) | 0.71% | 100.00 | 0.00% |
Fees & Availability
| Fees | |
| Actual 12B-1 Fee | 1.00% |
| Actual Management Fee | 0.34% |
| Administration Fee | 6.06K% |
| Maximum Front Load | -- |
| Maximum Deferred Load | 1.00% |
| Maximum Redemption Fee | -- |
| General Availability | |
| Available for Insurance Product | No |
| Available for RRSP | No |
| Purchase Details | |
| Open to New Investors |
|
| Minimum Initial Investment | 1000.00 None |
| Minimum Subsequent Investment | 0.00 None |
Basic Info
| Investment Strategy | |
| The Fund seeks total return through a combination of growth and income and preservation of capital in declining markets. Under normal circumstances, the Fund invests primarily in equity securities of foreign and domestic companies that the Advisor believes are undervalued, and in fixed income securities. |
| General | |
| Security Type | Mutual Fund |
| Equity Style | -- |
| Broad Asset Class | Allocation |
| Broad Category | Allocation |
| Global Peer Group | Mixed Asset USD Balanced - Global |
| Peer Group | Mixed-Asset Target Alloc Moderate Funds |
| Global Macro | Mixed Asset HC Balanced |
| US Macro | Mixed-Assets Target Allocation Funds |
| YCharts Categorization | -- |
| YCharts Benchmark | -- |
| Prospectus Objective | Growth Funds |
| Fund Owner Firm Name | Timothy Plan |
| Broad Asset Class Benchmark Index | |
| ^SPXTR | 100.0% |
Fundamentals
| General | |
| Distribution Yield | -- |
| Dividend Yield TTM (6-8-26) | 0.99% |
| 30-Day SEC Yield | -- |
| 7-Day SEC Yield | -- |
| Number of Holdings | 104 |
| Stock | |
| Weighted Average PE Ratio | 23.67 |
| Weighted Average Price to Sales Ratio | 3.078 |
| Weighted Average Price to Book Ratio | 4.567 |
| Weighted Median ROE | 74.05% |
| Weighted Median ROA | 6.75% |
| ROI (TTM) | 10.14% |
| Return on Investment (TTM) | 10.14% |
| Earning Yield | 0.0481 |
| LT Debt / Shareholders Equity | 1.103 |
| Number of Equity Holdings | 0 |
| Bond | |
| Yield to Maturity (3-31-26) | 4.68% |
| Effective Duration | -- |
| Average Coupon | 4.44% |
| Calculated Average Quality | 2.506 |
| Effective Maturity | 15.34 |
| Nominal Maturity | 15.37 |
| Number of Bond Holdings | 99 |
As of March 31, 2026
Growth Metrics
| EPS Growth (1Y) | 5.63% |
| EPS Growth (3Y) | 0.05% |
| EPS Growth (5Y) | 13.57% |
| Sales Growth (1Y) | 8.35% |
| Sales Growth (3Y) | 1.47% |
| Sales Growth (5Y) | 8.96% |
| Sales per Share Growth (1Y) | 7.82% |
| Sales per Share Growth (3Y) | 1.82% |
| Operating Cash Flow - Growth Rate (3Y) | 8.32% |
As of March 31, 2026
Top Portfolio Holders
| Name | % Weight |
|---|---|
| Portfolio A | 5.00% |
| Portfolio B | 3.50% |
| Portfolio C | 2.25% |
Excel Add-In Codes
| Name: =YCI("M:TGCIX", "name") |
| Broad Asset Class: =YCI("M:TGCIX", "broad_asset_class") |
| Broad Category: =YCI("M:TGCIX", "broad_category_group") |
| Prospectus Objective: =YCI("M:TGCIX", "prospectus_objective") |
| To find the codes for any of our securities and financial metrics, see our Complete Excel Reference. |