

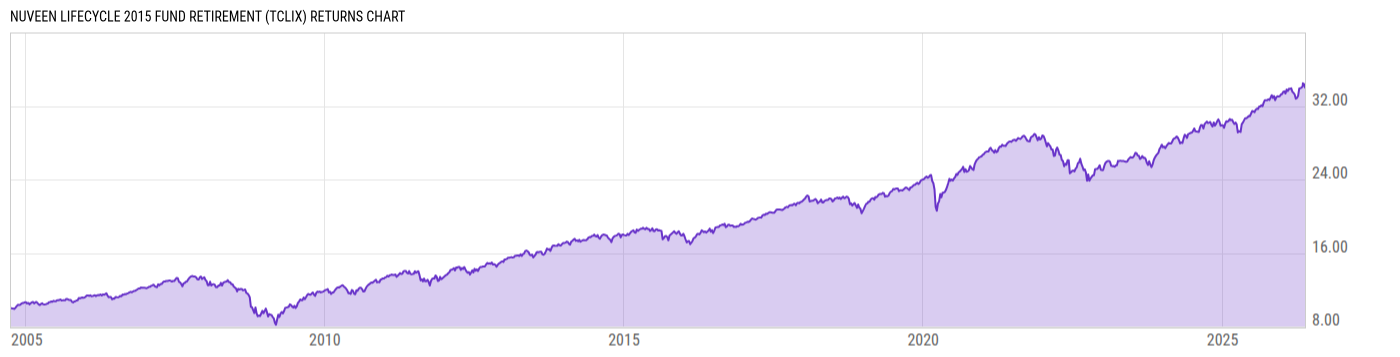
Nuveen Lifecycle 2015 Fund Retirement (TCLIX)
13.58
+0.02
(+0.15%)
USD |
Jun 09 2026
Returns Chart
Key Stats
| Net Expense Ratio | Total Assets Under Management | Weighted Average Dividend Yield | Turnover Ratio (Generic) |
|---|---|---|---|
| 0.62% | 922.59M | -- | 11.00% |
| 1 Year Fund Level Flows | 1 Year Total Returns (Daily) | Annualized Total Returns Since Inception (Daily) | Max Drawdown (Since Inception) |
| -165.90M | 11.07% |
Basic Info
| Investment Strategy | |
| The Fund seeks high total return over time through a combination of capital appreciation and income by investing in Underlying Funds according to an asset allocation strategy designed for investors planning to retire in or within a few years of 2015. |
| General | |
| Security Type | Mutual Fund |
| Equity Style | -- |
| Broad Asset Class | Allocation |
| Broad Category | Allocation |
| Global Peer Group | Target Maturity MA USD 2015 |
| Peer Group | Mixed-Asset Target 2015 Funds |
| Global Macro | Target Maturity |
| US Macro | Mixed-Assets Target Date Funds |
| YCharts Categorization | -- |
| YCharts Benchmark | -- |
| Prospectus Objective | Income Funds |
| Fund Owner Firm Name | Nuveen |
| Broad Asset Class Benchmark Index | |
| ^SPXTR | 100.0% |
Net Fund Flows Versus Peer Group
1 Month
% Rank:
77
-65.49M
Peer Group Low
17.19M
Peer Group High
1 Year
% Rank:
68
-165.90M
-783.49M
Peer Group Low
83.10M
Peer Group High
3 Months
% Rank:
77
-204.71M
Peer Group Low
20.81M
Peer Group High
3 Years
% Rank:
73
-2.628B
Peer Group Low
223.65M
Peer Group High
6 Months
% Rank:
73
-398.47M
Peer Group Low
53.08M
Peer Group High
5 Years
% Rank:
77
-4.819B
Peer Group Low
310.39M
Peer Group High
YTD
% Rank:
77
-318.79M
Peer Group Low
47.11M
Peer Group High
10 Years
% Rank:
90
-10.40B
Peer Group Low
396.51M
Peer Group High
Date Unavailable
Risk
Performance Versus Peer Group
Annual Total Returns Versus Peers
As of June 10, 2026.
Asset Allocation
As of April 30, 2026.
| Type | % Net |
|---|---|
| Cash | 1.22% |
| Stock | 35.91% |
| Bond | 58.75% |
| Convertible | 0.00% |
| Preferred | 0.19% |
| Other | 3.94% |
Top 10 Holdings
| Name | % Weight | Price | % Change |
|---|---|---|---|
| Nuveen Core Bond Fund W | 12.34% | 9.13 | 0.22% |
| Nuveen Short Term Bond Fund W | 10.55% | 10.11 | 0.00% |
| Nuveen Inflation Linked Bond Fund W | 9.83% | 10.91 | 0.09% |
| Nuveen Core Plus Bond Fund W | 9.25% | 9.15 | 0.11% |
| Nuveen International Bond Fund W | 5.39% | 8.94 | 0.22% |
| Nuveen Emerging Markets Debt Fund W | 4.32% | 9.17 | 0.22% |
| Nuveen High Yield Fund W | 4.29% | 8.85 | 0.00% |
| Nuveen Large Cap Growth Fund W | 3.90% | 30.10 | -0.53% |
| Nuveen Large Cap Value Fund W | 3.84% | 26.57 | 0.68% |
|
TIAA CREF Asset Management Core Property Fund LP
|
3.83% | -- | -- |
Fees & Availability
| Fees | |
| Actual 12B-1 Fee | -- |
| Actual Management Fee | 0.19% |
| Administration Fee | -- |
| Maximum Front Load | -- |
| Maximum Deferred Load | -- |
| Maximum Redemption Fee | -- |
| General Availability | |
| Available for Insurance Product | No |
| Available for RRSP | No |
| Purchase Details | |
| Open to New Investors |
|
| Minimum Initial Investment | 0.00 None |
| Minimum Subsequent Investment | 0.00 None |
Basic Info
| Investment Strategy | |
| The Fund seeks high total return over time through a combination of capital appreciation and income by investing in Underlying Funds according to an asset allocation strategy designed for investors planning to retire in or within a few years of 2015. |
| General | |
| Security Type | Mutual Fund |
| Equity Style | -- |
| Broad Asset Class | Allocation |
| Broad Category | Allocation |
| Global Peer Group | Target Maturity MA USD 2015 |
| Peer Group | Mixed-Asset Target 2015 Funds |
| Global Macro | Target Maturity |
| US Macro | Mixed-Assets Target Date Funds |
| YCharts Categorization | -- |
| YCharts Benchmark | -- |
| Prospectus Objective | Income Funds |
| Fund Owner Firm Name | Nuveen |
| Broad Asset Class Benchmark Index | |
| ^SPXTR | 100.0% |
Fundamentals
| General | |
| Distribution Yield | -- |
| Dividend Yield TTM (6-8-26) | 2.41% |
| 30-Day SEC Yield | -- |
| 7-Day SEC Yield | -- |
| Number of Holdings | 26 |
| Stock | |
| Weighted Average PE Ratio | 30.16 |
| Weighted Average Price to Sales Ratio | 6.998 |
| Weighted Average Price to Book Ratio | 8.369 |
| Weighted Median ROE | 100.0% |
| Weighted Median ROA | 12.86% |
| ROI (TTM) | 19.41% |
| Return on Investment (TTM) | 19.41% |
| Earning Yield | 0.0425 |
| LT Debt / Shareholders Equity | 24.26 |
| Number of Equity Holdings | 0 |
| Bond | |
| Yield to Maturity (4-30-26) | 4.46% |
| Effective Duration | -- |
| Average Coupon | 4.11% |
| Calculated Average Quality | 3.178 |
| Effective Maturity | 9.843 |
| Nominal Maturity | 10.05 |
| Number of Bond Holdings | 0 |
As of April 30, 2026
Growth Metrics
| EPS Growth (1Y) | 24.62% |
| EPS Growth (3Y) | 16.00% |
| EPS Growth (5Y) | 21.49% |
| Sales Growth (1Y) | 13.40% |
| Sales Growth (3Y) | 12.28% |
| Sales Growth (5Y) | 13.78% |
| Sales per Share Growth (1Y) | 18.67% |
| Sales per Share Growth (3Y) | 12.46% |
| Operating Cash Flow - Growth Rate (3Y) | 19.51% |
As of April 30, 2026
Top Portfolio Holders
| Name | % Weight |
|---|---|
| Portfolio A | 5.00% |
| Portfolio B | 3.50% |
| Portfolio C | 2.25% |
Excel Add-In Codes
| Name: =YCI("M:TCLIX", "name") |
| Broad Asset Class: =YCI("M:TCLIX", "broad_asset_class") |
| Broad Category: =YCI("M:TCLIX", "broad_category_group") |
| Prospectus Objective: =YCI("M:TCLIX", "prospectus_objective") |
| To find the codes for any of our securities and financial metrics, see our Complete Excel Reference. |