

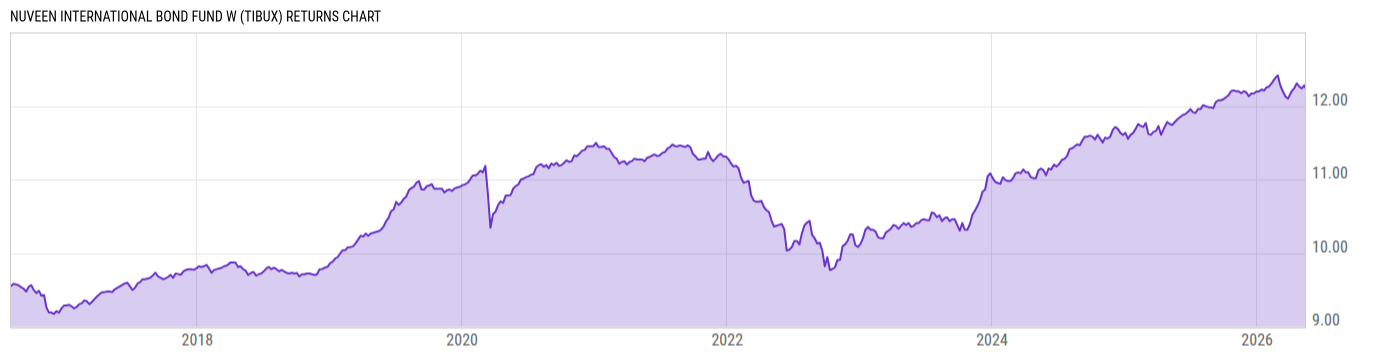
Nuveen International Bond Fund W (TIBUX)
8.95
-0.01
(-0.11%)
USD |
Jun 03 2026
Returns Chart
Key Stats
| Net Expense Ratio | Total Assets Under Management | Weighted Average Dividend Yield | Turnover Ratio (Generic) |
|---|---|---|---|
| 0.00% | 1.488B | -- | 30.00% |
| 1 Year Fund Level Flows | 1 Year Total Returns (Daily) | Annualized Total Returns Since Inception (Daily) | Max Drawdown (Since Inception) |
| 1.006B | 4.10% |
Basic Info
| Investment Strategy | |
| The Fund seeks a favorable long-term total return. It invests at least 80% of its assets in fixed-income investments of foreign issuers and derivative instruments, including those used to manage currency risk. It invests in a broad range of investment-grade sovereign, quasi-sovereign & corporate fixed-income investments. |
| General | |
| Security Type | Mutual Fund |
| Equity Style | -- |
| Broad Asset Class | Taxable Bond |
| Broad Category | Fixed Income |
| Global Peer Group | Bond Global USD |
| Peer Group | International Income Funds |
| Global Macro | Bond Global |
| US Macro | World Income Funds |
| YCharts Categorization | -- |
| YCharts Benchmark | -- |
| Prospectus Objective | International Income Funds |
| Fund Owner Firm Name | Nuveen |
| Broad Asset Class Benchmark Index | |
| ^BBUSATR | 100.0% |
Net Fund Flows Versus Peer Group
1 Month
% Rank:
36
-303.66M
Peer Group Low
2.820B
Peer Group High
1 Year
% Rank:
36
1.006B
-26.42M
Peer Group Low
18.54B
Peer Group High
3 Months
% Rank:
91
-150.34M
Peer Group Low
6.765B
Peer Group High
3 Years
% Rank:
37
-184.88M
Peer Group Low
34.51B
Peer Group High
6 Months
% Rank:
71
-79.22M
Peer Group Low
12.52B
Peer Group High
5 Years
% Rank:
39
-818.84M
Peer Group Low
101.76B
Peer Group High
YTD
% Rank:
72
-36.95M
Peer Group Low
11.18B
Peer Group High
10 Years
% Rank:
37
-5.018B
Peer Group Low
142.68B
Peer Group High
Date Unavailable
Risk
Performance Versus Peer Group
Annual Total Returns Versus Peers
As of June 04, 2026.
Asset Allocation
As of March 31, 2026.
| Type | % Net |
|---|---|
| Cash | 2.01% |
| Stock | 0.00% |
| Bond | 92.31% |
| Convertible | 0.00% |
| Preferred | 0.00% |
| Other | 5.69% |
Top 10 Holdings
| Name | % Weight | Price | % Change |
|---|---|---|---|
|
Other Assets less Liabilities
|
5.69% | -- | -- |
|
Japan (Government) .3% 20-SEP-2028
|
2.18% | -- | -- |
|
China, People's Republic of (Government) 2.67% 25-MAY-2033
|
2.17% | -- | -- |
|
United Kingdom of Great Britain and Northern Ireland (Government) 4% 22-OCT-2031
|
1.98% | -- | -- |
|
Fixed Income Clearing Corp Repo
|
1.97% | -- | -- |
|
Germany, Federal Republic of (Government) 2.2% 10-OCT-2030
|
1.89% | -- | -- |
| Canada CAN 3.5 09/01/2029 FIX CAD Government | 1.62% | 101.64 | -0.05% |
|
Japan (Government) .4% 20-MAR-2040
|
1.57% | -- | -- |
|
China, People's Republic of (Government) 1.45% 25-APR-2030
|
1.54% | -- | -- |
|
China, People's Republic of (Government) 2.55% 15-OCT-2028
|
1.51% | -- | -- |
Fees & Availability
| Fees | |
| Actual 12B-1 Fee | -- |
| Actual Management Fee | -- |
| Administration Fee | -- |
| Maximum Front Load | -- |
| Maximum Deferred Load | -- |
| Maximum Redemption Fee | -- |
| General Availability | |
| Available for Insurance Product | No |
| Available for RRSP | No |
| Purchase Details | |
| Open to New Investors |
|
| Minimum Initial Investment | 0.00 None |
| Minimum Subsequent Investment | 0.00 None |
Basic Info
| Investment Strategy | |
| The Fund seeks a favorable long-term total return. It invests at least 80% of its assets in fixed-income investments of foreign issuers and derivative instruments, including those used to manage currency risk. It invests in a broad range of investment-grade sovereign, quasi-sovereign & corporate fixed-income investments. |
| General | |
| Security Type | Mutual Fund |
| Equity Style | -- |
| Broad Asset Class | Taxable Bond |
| Broad Category | Fixed Income |
| Global Peer Group | Bond Global USD |
| Peer Group | International Income Funds |
| Global Macro | Bond Global |
| US Macro | World Income Funds |
| YCharts Categorization | -- |
| YCharts Benchmark | -- |
| Prospectus Objective | International Income Funds |
| Fund Owner Firm Name | Nuveen |
| Broad Asset Class Benchmark Index | |
| ^BBUSATR | 100.0% |
Fundamentals
| General | |
| Distribution Yield | -- |
| Dividend Yield TTM (6-2-26) | 2.31% |
| 30-Day SEC Yield (4-30-26) | 3.53% |
| 7-Day SEC Yield | -- |
| Number of Holdings | 494 |
| Bond | |
| Yield to Maturity (3-31-26) | 3.82% |
| Effective Duration | 6.11 |
| Average Coupon | 3.30% |
| Calculated Average Quality | 2.911 |
| Effective Maturity | 8.627 |
| Nominal Maturity | 8.690 |
| Number of Bond Holdings | 485 |
As of March 31, 2026
Fund Details
| Key Dates | |
| Inception Date | 9/28/2018 |
| Last Annual Report Date | 10/31/2025 |
| Last Prospectus Date | 2/27/2026 |
| Share Classes | |
| TIBEX | A |
| TIBLX | Premier |
| TIBNX | Inst |
| TIBVX | Retirement |
| TIBWX | Retirement |
| Attributes | |
| Index Fund | -- |
| Inverse Fund | No |
| Leveraged Fund | -- |
| Fund of Funds | No |
| Currency Hedged Fund | -- |
| Socially Responsible Fund | No |
Top Portfolio Holders
| Name | % Weight |
|---|---|
| Portfolio A | 5.00% |
| Portfolio B | 3.50% |
| Portfolio C | 2.25% |
Excel Add-In Codes
| Name: =YCI("M:TIBUX", "name") |
| Broad Asset Class: =YCI("M:TIBUX", "broad_asset_class") |
| Broad Category: =YCI("M:TIBUX", "broad_category_group") |
| Prospectus Objective: =YCI("M:TIBUX", "prospectus_objective") |
| To find the codes for any of our securities and financial metrics, see our Complete Excel Reference. |