

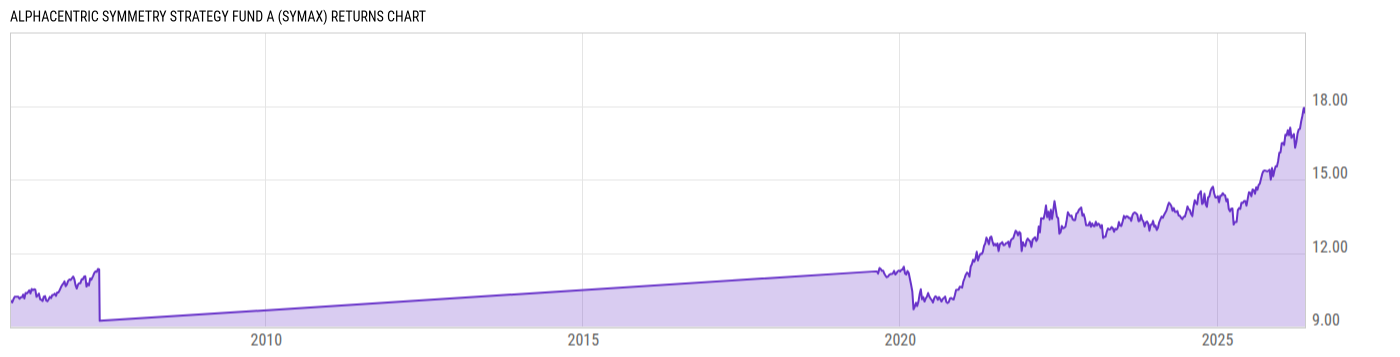
AlphaCentric Symmetry Strategy Fund A (SYMAX)
14.94
-0.08
(-0.53%)
USD |
Jun 10 2026
Returns Chart
Key Stats
| Net Expense Ratio | Total Assets Under Management | Weighted Average Dividend Yield | Turnover Ratio (Generic) |
|---|---|---|---|
| 1.97% | 55.66M | -- | 299.0% |
| 1 Year Fund Level Flows | 1 Year Total Returns (Daily) | Annualized Total Returns Since Inception (Daily) | Max Drawdown (Since Inception) |
| 3.181M | 22.06% |
Basic Info
| Investment Strategy | |
| The Fund seeks capital appreciation. The Fund employs two complementary strategies: Traditional Component Strategy and Alternative Component Strategy, and the Sub-Advisor uses a quantitative investment process for selecting portfolios of securities primarily in, but not limited to, the US, Europe, and Japan. |
| General | |
| Security Type | Mutual Fund |
| Equity Style | -- |
| Broad Asset Class | Allocation |
| Broad Category | Allocation |
| Global Peer Group | Mixed Asset USD Flexible - Global |
| Peer Group | Flexible Portfolio Funds |
| Global Macro | Mixed Asset HC Flexible |
| US Macro | Mixed-Assets Funds |
| YCharts Categorization | -- |
| YCharts Benchmark | -- |
| Prospectus Objective | Flexible Portfolio Funds |
| Fund Owner Firm Name | AlphaCentric |
| Broad Asset Class Benchmark Index | |
| ^SPXTR | 100.0% |
Net Fund Flows Versus Peer Group
1 Month
% Rank:
20
-283.22M
Peer Group Low
1.433B
Peer Group High
1 Year
% Rank:
27
3.181M
-3.136B
Peer Group Low
12.63B
Peer Group High
3 Months
% Rank:
29
-727.84M
Peer Group Low
12.63B
Peer Group High
3 Years
% Rank:
36
-12.10B
Peer Group Low
12.63B
Peer Group High
6 Months
% Rank:
25
-1.420B
Peer Group Low
12.63B
Peer Group High
5 Years
% Rank:
42
-14.65B
Peer Group Low
12.63B
Peer Group High
YTD
% Rank:
27
-1.211B
Peer Group Low
12.63B
Peer Group High
10 Years
% Rank:
35
-47.19B
Peer Group Low
12.63B
Peer Group High
Date Unavailable
Risk
Performance Versus Peer Group
Annual Total Returns Versus Peers
As of June 11, 2026.
Asset Allocation
As of December 31, 2025.
| Type | % Net |
|---|---|
| Cash | 8.45% |
| Stock | 52.41% |
| Bond | 27.19% |
| Convertible | 0.05% |
| Preferred | 0.75% |
| Other | 11.16% |
Top 10 Holdings
| Name | % Weight | Price | % Change |
|---|---|---|---|
|
Access Fund Ltd
|
14.68% | -- | -- |
| First American Treasury Obligations Fund X | 6.49% | 1.00 | 0.00% |
| Invesco S&P 500 Pure Value ETF | 4.95% | 114.72 | 0.39% |
| iShares Russell 1000 Value ETF | 4.88% | 237.35 | 0.90% |
| United States of America USGB 04/14/2026 FIX USD Government (Matured) | 3.66% | 100.00 | 0.01% |
| United States of America USGB 04/30/2026 FIX USD Government (Matured) | 3.66% | 100.00 | 0.01% |
| United States of America USGB 05/12/2026 FIX USD Government (Matured) | 3.65% | 100.00 | 0.01% |
|
USD Cash
|
2.84% | -- | -- |
| United States of America USGB 05/28/2026 FIX USD Government (Matured) | 1.92% | 100.00 | 0.01% |
| iShares 1-3 Year Treasury Bond ETF | 1.51% | 81.95 | 0.01% |
Fees & Availability
| Fees | |
| Actual 12B-1 Fee | 0.25% |
| Actual Management Fee | 0.98% |
| Administration Fee | 294.0% |
| Maximum Front Load | 5.75% |
| Maximum Deferred Load | -- |
| Maximum Redemption Fee | -- |
| General Availability | |
| Available for Insurance Product | No |
| Available for RRSP | No |
| Purchase Details | |
| Open to New Investors |
|
| Minimum Initial Investment | 2500.00 None |
| Minimum Subsequent Investment | 100.00 None |
Basic Info
| Investment Strategy | |
| The Fund seeks capital appreciation. The Fund employs two complementary strategies: Traditional Component Strategy and Alternative Component Strategy, and the Sub-Advisor uses a quantitative investment process for selecting portfolios of securities primarily in, but not limited to, the US, Europe, and Japan. |
| General | |
| Security Type | Mutual Fund |
| Equity Style | -- |
| Broad Asset Class | Allocation |
| Broad Category | Allocation |
| Global Peer Group | Mixed Asset USD Flexible - Global |
| Peer Group | Flexible Portfolio Funds |
| Global Macro | Mixed Asset HC Flexible |
| US Macro | Mixed-Assets Funds |
| YCharts Categorization | -- |
| YCharts Benchmark | -- |
| Prospectus Objective | Flexible Portfolio Funds |
| Fund Owner Firm Name | AlphaCentric |
| Broad Asset Class Benchmark Index | |
| ^SPXTR | 100.0% |
Fundamentals
| General | |
| Distribution Yield | -- |
| Dividend Yield TTM (6-10-26) | 0.00% |
| 30-Day SEC Yield | -- |
| 7-Day SEC Yield | -- |
| Number of Holdings | 205 |
| Stock | |
| Weighted Average PE Ratio | 24.55 |
| Weighted Average Price to Sales Ratio | 4.394 |
| Weighted Average Price to Book Ratio | 5.432 |
| Weighted Median ROE | 94.81% |
| Weighted Median ROA | 7.43% |
| ROI (TTM) | 48.99% |
| Return on Investment (TTM) | 48.99% |
| Earning Yield | 0.0567 |
| LT Debt / Shareholders Equity | 1.660 |
| Number of Equity Holdings | 93 |
| Bond | |
| Yield to Maturity (12-31-25) | 3.89% |
| Effective Duration | -- |
| Average Coupon | 4.93% |
| Calculated Average Quality | 4.183 |
| Effective Maturity | 2.561 |
| Nominal Maturity | 2.767 |
| Number of Bond Holdings | 5 |
As of December 31, 2025
Growth Metrics
| EPS Growth (1Y) | 31.28% |
| EPS Growth (3Y) | 12.33% |
| EPS Growth (5Y) | 11.16% |
| Sales Growth (1Y) | 12.34% |
| Sales Growth (3Y) | 12.22% |
| Sales Growth (5Y) | 11.12% |
| Sales per Share Growth (1Y) | 14.88% |
| Sales per Share Growth (3Y) | 11.91% |
| Operating Cash Flow - Growth Rate (3Y) | 14.38% |
As of December 31, 2025
Top Portfolio Holders
| Name | % Weight |
|---|---|
| Portfolio A | 5.00% |
| Portfolio B | 3.50% |
| Portfolio C | 2.25% |
Excel Add-In Codes
| Name: =YCI("M:SYMAX", "name") |
| Broad Asset Class: =YCI("M:SYMAX", "broad_asset_class") |
| Broad Category: =YCI("M:SYMAX", "broad_category_group") |
| Prospectus Objective: =YCI("M:SYMAX", "prospectus_objective") |
| To find the codes for any of our securities and financial metrics, see our Complete Excel Reference. |