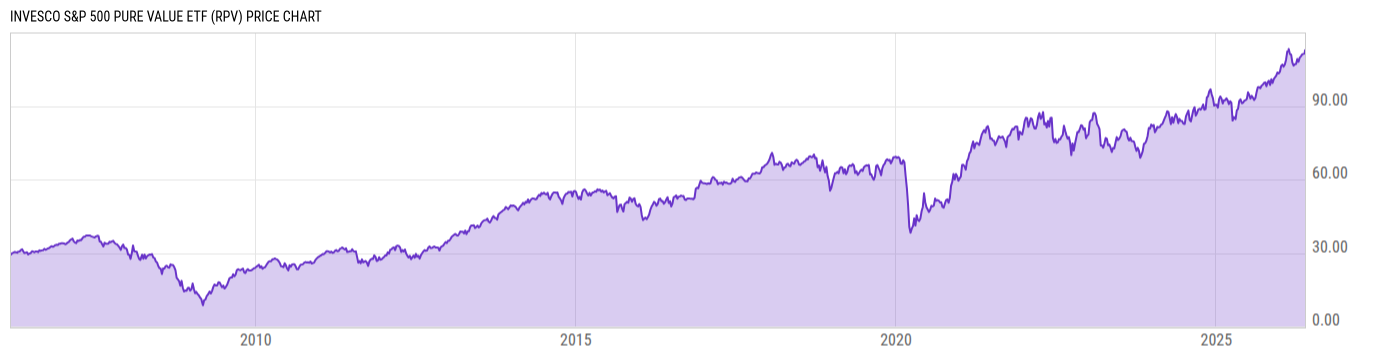
Invesco S&P 500® Pure Value ETF (RPV)
65.59
-0.52 (-0.79%)
USD |
Jan 21, 20:00
Price Chart
Key Stats
Customize
Expense Ratio | Discount or Premium to NAV | Total Assets Under Management | 30-Day Average Daily Volume |
---|---|---|---|
0.35% | -0.06% | 1.236B | 400705.2 |
Dividend Yield | Turnover Ratio | 1 Year Fund Level Flows | Max Drawdown (All) |
1.98% | 46.00% | 164.92M | Upgrade |
Basic Info
Investment Strategy | |
The investment seeks to track the investment results (before fees and expenses) of the S&P 500® Pure Value Index (the "underlying index"). The fund generally will invest at least 90% of its total assets in the securities that comprise the underlying index. The underlying index is composed of a subset of securities from the S&P 500® Index that exhibit strong value characteristics. The fund is non-diversified. |
General | |
Security Type | Exchange-Traded Fund |
Equity Style | Large Cap/Value |
Fixed Income Style | -- |
Broad Asset Class | US Equity |
Broad Category | Equity |
Category Name | Large Value |
Category Index | Russell 1000 Value TR USD |
Prospectus Objective | Growth |
Fund Owner Firm Name | Invesco |
Prospectus Benchmark Index | |
S&P 500 Pure Value TR USD | 100.0% |
Broad Asset Class Benchmark Index | |
^SPXTR | 100.0% |
Manager Tenure | |
Michael Jeanette | 2.73 yrs |
Peter Hubbard | 2.73 yrs |
Tony Seisser | 2.73 yrs |
Pratik Doshi | 0.34 yrs |
Net Fund Flows Versus Category
1 Month
% Rank:
--
--
Category Low
--
Category High
1 Year
% Rank:
13
164.92M
-7.485B
Category Low
6.559B
Category High
3 Months
% Rank:
--
--
Category Low
--
Category High
3 Years
% Rank:
--
--
Category Low
--
Category High
6 Months
% Rank:
--
--
Category Low
--
Category High
5 Years
% Rank:
--
--
Category Low
--
Category High
YTD
% Rank:
--
--
Category Low
--
Category High
10 Years
% Rank:
--
--
Category Low
--
Category High
As of December 31, 2020
Performance Versus Category
As of January 20, 2021. Returns for periods of 1 year and above are annualized.
Annual Total Returns Versus Peers
Edit comparables
As of January 20, 2021.
Asset Allocation
Top 10 Holdings
Name | % Weight | Price | % Change |
---|---|---|---|
Unum Group | 2.26% | 25.49 | -1.47% |
Berkshire Hathaway Inc Class B | 2.11% | 234.16 | -0.26% |
Lumen Technologies Inc Ordinary Shares | 1.79% | 11.09 | 0.27% |
HollyFrontier Corp | 1.78% | 28.68 | -2.05% |
Lincoln National Corp | 1.75% | 51.21 | -2.40% |
MetLife Inc | 1.72% | 51.07 | -1.12% |
Prudential Financial Inc | 1.70% | 82.86 | -1.37% |
CVS Health Corp | 1.62% | 74.08 | -1.55% |
Ford Motor Co | 1.62% | 11.53 | 6.17% |
Valero Energy Corp | 1.54% | 58.86 | -2.82% |
News
Headline
Wire
Time (ET)
Globe Newswire
03/15 19:16
Globe Newswire
09/14 19:06
Globe Newswire
06/15 18:29
Basic Info
Investment Strategy | |
The investment seeks to track the investment results (before fees and expenses) of the S&P 500® Pure Value Index (the "underlying index"). The fund generally will invest at least 90% of its total assets in the securities that comprise the underlying index. The underlying index is composed of a subset of securities from the S&P 500® Index that exhibit strong value characteristics. The fund is non-diversified. |
General | |
Security Type | Exchange-Traded Fund |
Equity Style | Large Cap/Value |
Fixed Income Style | -- |
Broad Asset Class | US Equity |
Broad Category | Equity |
Category Name | Large Value |
Category Index | Russell 1000 Value TR USD |
Prospectus Objective | Growth |
Fund Owner Firm Name | Invesco |
Prospectus Benchmark Index | |
S&P 500 Pure Value TR USD | 100.0% |
Broad Asset Class Benchmark Index | |
^SPXTR | 100.0% |
Manager Tenure | |
Michael Jeanette | 2.73 yrs |
Peter Hubbard | 2.73 yrs |
Tony Seisser | 2.73 yrs |
Pratik Doshi | 0.34 yrs |
Fundamentals
General | |
Distribution Yield | Upgrade |
Dividend Yield TTM (1-21-21) | 1.98% |
30-Day SEC Yield (12-31-20) | Upgrade |
7-Day SEC Yield | -- |
Number of Holdings | Upgrade |
Stock | |
Weighted Average PE Ratio | 14.09 |
Weighted Average Price to Sales Ratio | Upgrade |
Weighted Average Price to Book Ratio | Upgrade |
Weighted Median ROE | Upgrade |
Weighted Median ROA | Upgrade |
Forecasted Dividend Yield | Upgrade |
Forecasted PE Ratio | Upgrade |
Forecasted Price to Sales Ratio | Upgrade |
Forecasted Price to Book Ratio | Upgrade |
As of January 20, 2021
Growth Estimates
Fund Details
Key Dates | |
Inception Date | 3/1/2006 |
Last Annual Report Date | 4/30/2020 |
Last Prospectus Date | 8/28/2020 |
Attributes | |
Enhanced Index Fund | No |
Index Fund |
|
Inverse Fund | No |
Leveraged Fund | No |
Fund of Funds | No |
Currency Hedged Fund | No |
Synthetic Replication Fund | No |
Has Dividend Investment Plan | No |
Socially Responsible Fund | No |
News
Headline
Wire
Time (ET)
Globe Newswire
03/15 19:16
Globe Newswire
09/14 19:06
Globe Newswire
06/15 18:29