

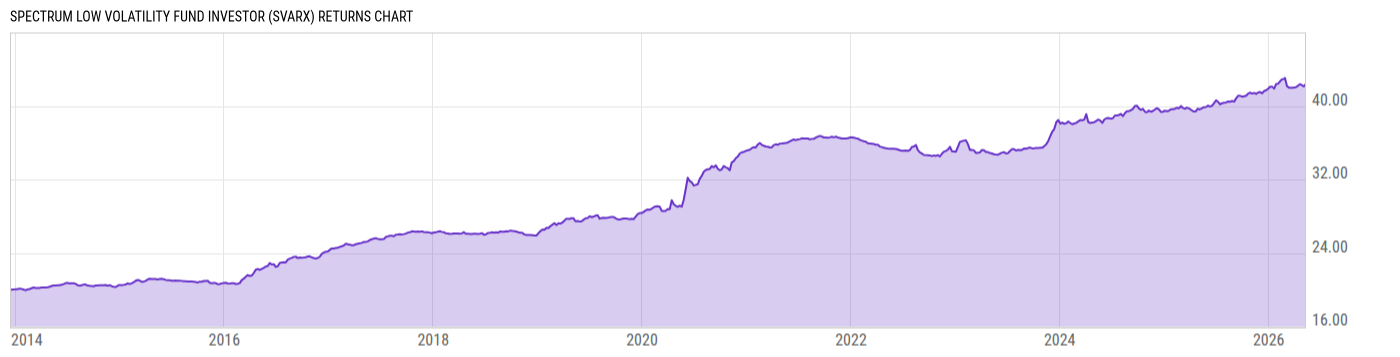
Spectrum Low Volatility Fund Investor (SVARX)
23.88
+0.04
(+0.17%)
USD |
May 08 2026
Returns Chart
Key Stats
| Net Expense Ratio | Total Assets Under Management | Weighted Average Dividend Yield | Turnover Ratio (Generic) |
|---|---|---|---|
| 2.99% | 164.09M | -- | 529.0% |
| 1 Year Fund Level Flows | 1 Year Total Returns (Daily) | Annualized Total Returns Since Inception (Daily) | Max Drawdown (Since Inception) |
| -37.59M | 6.66% |
Basic Info
| Investment Strategy | |
| The Fund seeks to provide total return with lower downside volatility and risk compared to major stock market indices. The Fund's sub-adviser uses a flexible investment approach to seek total return from capital appreciation and income from interest payments while managing downside volatility and risk. |
| General | |
| Security Type | Mutual Fund |
| Equity Style | -- |
| Broad Asset Class | Allocation |
| Broad Category | Allocation |
| Global Peer Group | Mixed Asset USD Flexible - US |
| Peer Group | Flexible Portfolio Funds |
| Global Macro | Mixed Asset HC Flexible |
| US Macro | Mixed-Assets Funds |
| YCharts Categorization | -- |
| YCharts Benchmark | -- |
| Prospectus Objective | Flexible Portfolio Funds |
| Fund Owner Firm Name | Advisors Preferred |
| Broad Asset Class Benchmark Index | |
| ^SPXTR | 100.0% |
Net Fund Flows Versus Peer Group
1 Month
% Rank:
79
-159.25M
Peer Group Low
2.445B
Peer Group High
1 Year
% Rank:
64
-37.59M
-3.214B
Peer Group Low
2.543B
Peer Group High
3 Months
% Rank:
72
-582.29M
Peer Group Low
2.445B
Peer Group High
3 Years
% Rank:
65
-12.12B
Peer Group Low
4.168B
Peer Group High
6 Months
% Rank:
66
-1.396B
Peer Group Low
2.445B
Peer Group High
5 Years
% Rank:
67
-14.74B
Peer Group Low
4.971B
Peer Group High
YTD
% Rank:
72
-927.39M
Peer Group Low
2.445B
Peer Group High
10 Years
% Rank:
32
-47.38B
Peer Group Low
9.619B
Peer Group High
Date Unavailable
Risk
Performance Versus Peer Group
Annual Total Returns Versus Peers
As of May 10, 2026.
Asset Allocation
As of December 31, 2025.
| Type | % Net |
|---|---|
| Cash | 41.44% |
| Stock | 2.28% |
| Bond | 45.32% |
| Convertible | 0.00% |
| Preferred | 0.85% |
| Other | 10.11% |
Top 10 Holdings
| Name | % Weight | Price | % Change |
|---|---|---|---|
|
USD Cash
|
40.11% | -- | -- |
| AQR Equity Market Neutral Fund R6 | 10.81% | 11.64 | -0.94% |
| Nationwide Strategic Income Fund R6 | 10.62% | 10.19 | 0.00% |
| JPMorgan Preferred and Income Securities Fund R6 | 10.19% | 9.85 | 0.10% |
| Axonic Strategic Income Fund I | 5.93% | 8.90 | 0.00% |
| Holbrook Structured Income Fund I | 5.43% | 9.74 | 0.00% |
| Medalist Partners MBS Total Return Fund Inst | 5.22% | 8.64 | 0.12% |
| AQR Diversifying Strategies Fund R6 | 5.16% | 14.74 | 0.27% |
| AQR Long-Short Equity Fund R6 | 5.01% | 20.99 | -0.33% |
| United States of America USGB 02/19/2026 FIX USD Government (Matured) | 2.39% | 100.00 | 0.00% |
Fees & Availability
| Fees | |
| Actual 12B-1 Fee | -- |
| Actual Management Fee | 2.15% |
| Administration Fee | 417.6K% |
| Maximum Front Load | -- |
| Maximum Deferred Load | -- |
| Maximum Redemption Fee | -- |
| General Availability | |
| Available for Insurance Product | No |
| Available for RRSP | No |
| Purchase Details | |
| Open to New Investors |
|
| Minimum Initial Investment | 1000.00 None |
| Minimum Subsequent Investment | 500.00 None |
Basic Info
| Investment Strategy | |
| The Fund seeks to provide total return with lower downside volatility and risk compared to major stock market indices. The Fund's sub-adviser uses a flexible investment approach to seek total return from capital appreciation and income from interest payments while managing downside volatility and risk. |
| General | |
| Security Type | Mutual Fund |
| Equity Style | -- |
| Broad Asset Class | Allocation |
| Broad Category | Allocation |
| Global Peer Group | Mixed Asset USD Flexible - US |
| Peer Group | Flexible Portfolio Funds |
| Global Macro | Mixed Asset HC Flexible |
| US Macro | Mixed-Assets Funds |
| YCharts Categorization | -- |
| YCharts Benchmark | -- |
| Prospectus Objective | Flexible Portfolio Funds |
| Fund Owner Firm Name | Advisors Preferred |
| Broad Asset Class Benchmark Index | |
| ^SPXTR | 100.0% |
Fundamentals
| General | |
| Distribution Yield | -- |
| Dividend Yield TTM (5-7-26) | 5.88% |
| 30-Day SEC Yield | -- |
| 7-Day SEC Yield | -- |
| Number of Holdings | 27 |
| Bond | |
| Yield to Maturity (12-31-25) | 4.91% |
| Effective Duration | -- |
| Average Coupon | 6.53% |
| Calculated Average Quality | 3.789 |
| Effective Maturity | 12.69 |
| Nominal Maturity | 15.38 |
| Number of Bond Holdings | 1 |
As of December 31, 2025
Fund Details
| Key Dates | |
| Inception Date | 12/16/2013 |
| Last Annual Report Date | 9/30/2025 |
| Last Prospectus Date | 2/1/2026 |
| Attributes | |
| Index Fund | -- |
| Inverse Fund | No |
| Leveraged Fund | -- |
| Fund of Funds |
|
| Currency Hedged Fund | -- |
| Socially Responsible Fund | No |
Top Portfolio Holders
| Name | % Weight |
|---|---|
| Portfolio A | 5.00% |
| Portfolio B | 3.50% |
| Portfolio C | 2.25% |
Excel Add-In Codes
| Name: =YCI("M:SVARX", "name") |
| Broad Asset Class: =YCI("M:SVARX", "broad_asset_class") |
| Broad Category: =YCI("M:SVARX", "broad_category_group") |
| Prospectus Objective: =YCI("M:SVARX", "prospectus_objective") |
| To find the codes for any of our securities and financial metrics, see our Complete Excel Reference. |