

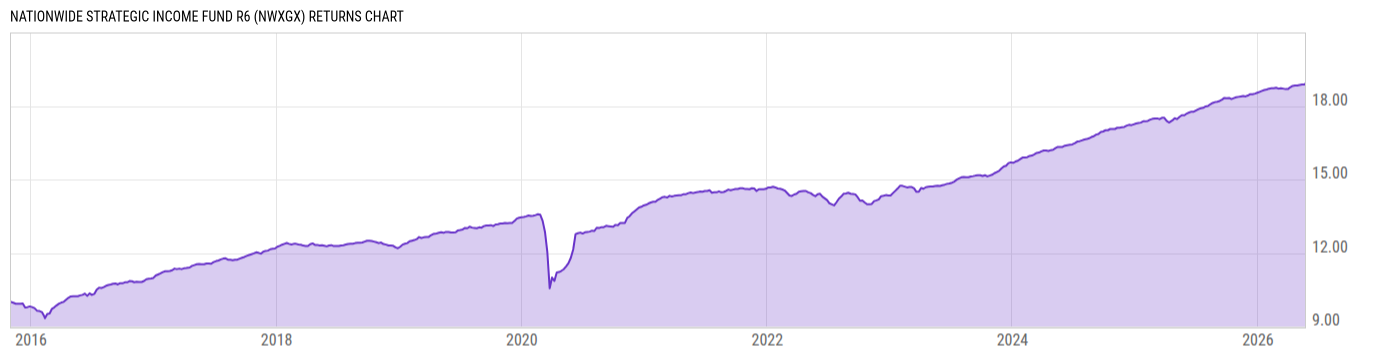
Nationwide Strategic Income Fund R6 (NWXGX)
10.21
0.00 (0.00%)
USD |
Jun 08 2026
Returns Chart
Key Stats
| Net Expense Ratio | Total Assets Under Management | Weighted Average Dividend Yield | Turnover Ratio (Generic) |
|---|---|---|---|
| 0.49% | 2.205B | -- | 290.0% |
| 1 Year Fund Level Flows | 1 Year Total Returns (Daily) | Annualized Total Returns Since Inception (Daily) | Max Drawdown (Since Inception) |
| 1.059B | 7.05% |
Basic Info
| Investment Strategy | |
| The Fund seeks to provide a high level of current income. The Fund employs a flexible investment approach, allocating across different types of fixed-income securities with few limitations as to credit quality, geography, maturity or sector, with the goal of achieving a high level of current income. |
| General | |
| Security Type | Mutual Fund |
| Equity Style | -- |
| Broad Asset Class | Taxable Bond |
| Broad Category | Fixed Income |
| Global Peer Group | Bond Global USD |
| Peer Group | Multi-Sector Income Funds |
| Global Macro | Bond Global |
| US Macro | General Domestic Taxable Fixed Income Funds |
| YCharts Categorization | -- |
| YCharts Benchmark | -- |
| Prospectus Objective | Multi-Sector Income Funds |
| Fund Owner Firm Name | Nationwide |
| Broad Asset Class Benchmark Index | |
| ^BBUSATR | 100.0% |
Net Fund Flows Versus Peer Group
1 Month
% Rank:
12
-144.76M
Peer Group Low
572.86M
Peer Group High
1 Year
% Rank:
14
1.059B
-1.545B
Peer Group Low
30.94B
Peer Group High
3 Months
% Rank:
11
-480.71M
Peer Group Low
1.683B
Peer Group High
3 Years
% Rank:
19
-4.573B
Peer Group Low
71.08B
Peer Group High
6 Months
% Rank:
13
-777.58M
Peer Group Low
12.53B
Peer Group High
5 Years
% Rank:
17
-7.509B
Peer Group Low
61.00B
Peer Group High
YTD
% Rank:
12
-627.92M
Peer Group Low
8.773B
Peer Group High
10 Years
% Rank:
22
-13.91B
Peer Group Low
116.77B
Peer Group High
Date Unavailable
Risk
Performance Versus Peer Group
Annual Total Returns Versus Peers
As of June 09, 2026.
Asset Allocation
As of April 30, 2026.
| Type | % Net |
|---|---|
| Cash | 4.41% |
| Stock | 0.29% |
| Bond | 96.76% |
| Convertible | 0.00% |
| Preferred | 0.74% |
| Other | -2.20% |
Top 10 Holdings
| Name | % Weight | Price | % Change |
|---|---|---|---|
|
Federal National Mortgage Association 2.5% 01-JUN-2056
|
4.75% | -- | -- |
|
USD Cash
|
4.40% | -- | -- |
| United States of America USGB 05/05/2026 FIX USD Government (Matured) | 2.88% | 100.00 | 0.01% |
|
Federal National Mortgage Association 3.5% 01-MAY-2056
|
2.59% | -- | -- |
|
Federal National Mortgage Association 5.5% 01-MAY-2056
|
2.08% | -- | -- |
| United States of America USGB 05/19/2026 FIX USD Government (Matured) | 0.96% | 100.00 | 0.01% |
| Morgan Stanley MWD 4.555 04/10/2030 FLT USD Corporate '29 | 0.96% | 99.26 | 0.12% |
| Total Play Telecomunicaciones, S.A.P.I. de C.V. TOTALPL 11.125 12/31/2032 FIX USD Corporate 144A | 0.94% | 96.62 | 0.45% |
| Federative Republic of Brazil BRAZIL 6.25 05/22/2036 FIX USD Sovereign | 0.90% | 98.43 | -0.23% |
| Meiji Yasuda Life Insurance Company MJY 6.1 06/11/2055 FLT USD Corporate 144A '35 | 0.86% | 101.05 | -0.63% |
Fees & Availability
| Fees | |
| Actual 12B-1 Fee | -- |
| Actual Management Fee | 0.42% |
| Administration Fee | 26.90K% |
| Maximum Front Load | -- |
| Maximum Deferred Load | -- |
| Maximum Redemption Fee | -- |
| General Availability | |
| Available for Insurance Product | No |
| Available for RRSP | No |
| Purchase Details | |
| Open to New Investors |
|
| Minimum Initial Investment | 1.00M None |
| Minimum Subsequent Investment | 0.00 None |
Basic Info
| Investment Strategy | |
| The Fund seeks to provide a high level of current income. The Fund employs a flexible investment approach, allocating across different types of fixed-income securities with few limitations as to credit quality, geography, maturity or sector, with the goal of achieving a high level of current income. |
| General | |
| Security Type | Mutual Fund |
| Equity Style | -- |
| Broad Asset Class | Taxable Bond |
| Broad Category | Fixed Income |
| Global Peer Group | Bond Global USD |
| Peer Group | Multi-Sector Income Funds |
| Global Macro | Bond Global |
| US Macro | General Domestic Taxable Fixed Income Funds |
| YCharts Categorization | -- |
| YCharts Benchmark | -- |
| Prospectus Objective | Multi-Sector Income Funds |
| Fund Owner Firm Name | Nationwide |
| Broad Asset Class Benchmark Index | |
| ^BBUSATR | 100.0% |
Fundamentals
| General | |
| Distribution Yield | -- |
| Dividend Yield TTM (6-5-26) | 5.70% |
| 30-Day SEC Yield (10-31-19) | 0.00% |
| 7-Day SEC Yield | -- |
| Number of Holdings | 727 |
| Bond | |
| Yield to Maturity (4-30-26) | 5.74% |
| Effective Duration | 1.44 |
| Average Coupon | 6.18% |
| Calculated Average Quality | 3.562 |
| Effective Maturity | 13.28 |
| Nominal Maturity | 13.31 |
| Number of Bond Holdings | 659 |
As of April 30, 2026
Fund Details
Top Portfolio Holders
| Name | % Weight |
|---|---|
| Portfolio A | 5.00% |
| Portfolio B | 3.50% |
| Portfolio C | 2.25% |
Excel Add-In Codes
| Name: =YCI("M:NWXGX", "name") |
| Broad Asset Class: =YCI("M:NWXGX", "broad_asset_class") |
| Broad Category: =YCI("M:NWXGX", "broad_category_group") |
| Prospectus Objective: =YCI("M:NWXGX", "prospectus_objective") |
| To find the codes for any of our securities and financial metrics, see our Complete Excel Reference. |