

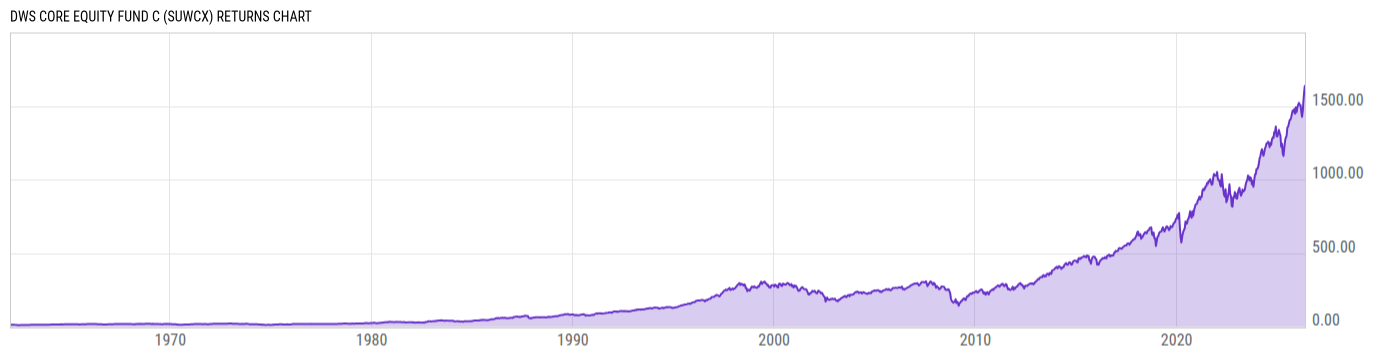
DWS Core Equity Fund C (SUWCX)
33.90
-0.61
(-1.77%)
USD |
Jun 10 2026
Returns Chart
Key Stats
| Net Expense Ratio | Total Assets Under Management | Weighted Average Dividend Yield | Turnover Ratio (Generic) |
|---|---|---|---|
| 1.60% | 4.790B | 1.13% | 27.00% |
| 1 Year Fund Level Flows | 1 Year Total Returns (Daily) | Annualized Total Returns Since Inception (Daily) | Max Drawdown (Since Inception) |
| -479.52M | 21.09% |
Basic Info
| Investment Strategy | |
| The Fund seeks long-term growth of capital, current income, and growth of income. The Fund invests at least 80% of total assets, determined at the time of purchase, in equities, mainly common stocks. Although the fund can invest in companies of any size and from any country, it invests primarily in large US companies. |
| General | |
| Security Type | Mutual Fund |
| Equity Style | Multi Cap Core |
| Broad Asset Class | US Equity |
| Broad Category | Equity |
| Global Peer Group | Equity US |
| Peer Group | Multi-Cap Core Funds |
| Global Macro | Equity North America |
| US Macro | Multi-Cap Funds |
| YCharts Categorization | -- |
| YCharts Benchmark | -- |
| Prospectus Objective | Growth & Income Funds |
| Fund Owner Firm Name | DWS |
| Broad Asset Class Benchmark Index | |
| ^SPXTR | 100.0% |
Net Fund Flows Versus Peer Group
1 Month
% Rank:
85
-7.762B
Peer Group Low
4.060B
Peer Group High
1 Year
% Rank:
84
-479.52M
-42.78B
Peer Group Low
40.70B
Peer Group High
3 Months
% Rank:
89
-3.143B
Peer Group Low
15.42B
Peer Group High
3 Years
% Rank:
85
-35.12B
Peer Group Low
86.13B
Peer Group High
6 Months
% Rank:
87
-1.612B
Peer Group Low
28.18B
Peer Group High
5 Years
% Rank:
88
-18.51B
Peer Group Low
102.57B
Peer Group High
YTD
% Rank:
88
-1.072B
Peer Group Low
19.70B
Peer Group High
10 Years
% Rank:
89
-55.12B
Peer Group Low
199.91B
Peer Group High
Date Unavailable
Risk
Performance Versus Peer Group
Annual Total Returns Versus Peers
As of June 11, 2026.
Asset Allocation
As of March 31, 2026.
| Type | % Net |
|---|---|
| Cash | 0.00% |
| Stock | 98.92% |
| Bond | 0.11% |
| Convertible | 0.00% |
| Preferred | 0.00% |
| Other | 0.97% |
Top 10 Holdings
| Name | % Weight | Price | % Change |
|---|---|---|---|
| Apple, Inc. | 8.90% | 293.30 | 0.59% |
| Microsoft Corp. | 6.69% | 384.82 | -3.16% |
| NVIDIA Corp. | 6.37% | 199.95 | -0.23% |
| Alphabet, Inc. | 5.45% | 344.20 | -2.58% |
| Amazon.com, Inc. | 4.13% | 236.09 | -0.80% |
| JPMorgan Chase & Co. | 3.03% | 310.61 | 0.48% |
| Meta Platforms, Inc. | 2.20% | 560.10 | -1.91% |
| AbbVie, Inc. | 2.03% | 225.60 | 0.29% |
| Walmart, Inc. | 1.94% | 121.24 | 0.54% |
| Visa, Inc. | 1.88% | 319.03 | -1.22% |
Fees & Availability
| Fees | |
| Actual 12B-1 Fee | 1.00% |
| Actual Management Fee | 0.35% |
| Administration Fee | 18.88K% |
| Maximum Front Load | 0.00% |
| Maximum Deferred Load | 1.00% |
| Maximum Redemption Fee | 0.00% |
| General Availability | |
| Available for Insurance Product | No |
| Available for RRSP | No |
| Purchase Details | |
| Open to New Investors |
|
| Minimum Initial Investment | 1000.00 None |
| Minimum Subsequent Investment | 50.00 None |
Basic Info
| Investment Strategy | |
| The Fund seeks long-term growth of capital, current income, and growth of income. The Fund invests at least 80% of total assets, determined at the time of purchase, in equities, mainly common stocks. Although the fund can invest in companies of any size and from any country, it invests primarily in large US companies. |
| General | |
| Security Type | Mutual Fund |
| Equity Style | Multi Cap Core |
| Broad Asset Class | US Equity |
| Broad Category | Equity |
| Global Peer Group | Equity US |
| Peer Group | Multi-Cap Core Funds |
| Global Macro | Equity North America |
| US Macro | Multi-Cap Funds |
| YCharts Categorization | -- |
| YCharts Benchmark | -- |
| Prospectus Objective | Growth & Income Funds |
| Fund Owner Firm Name | DWS |
| Broad Asset Class Benchmark Index | |
| ^SPXTR | 100.0% |
Fundamentals
| General | |
| Distribution Yield | -- |
| Dividend Yield TTM (6-10-26) | 0.00% |
| 30-Day SEC Yield | -- |
| 7-Day SEC Yield | -- |
| Number of Holdings | 98 |
| Stock | |
| Weighted Average PE Ratio | 29.88 |
| Weighted Average Price to Sales Ratio | 7.426 |
| Weighted Average Price to Book Ratio | 10.71 |
| Weighted Median ROE | 173.2% |
| Weighted Median ROA | 16.56% |
| ROI (TTM) | 24.04% |
| Return on Investment (TTM) | 24.04% |
| Earning Yield | 0.0406 |
| LT Debt / Shareholders Equity | 0.7922 |
| Number of Equity Holdings | 93 |
As of March 31, 2026
Growth Metrics
| EPS Growth (1Y) | 22.28% |
| EPS Growth (3Y) | 19.05% |
| EPS Growth (5Y) | 23.68% |
| Sales Growth (1Y) | 14.06% |
| Sales Growth (3Y) | 14.21% |
| Sales Growth (5Y) | 16.32% |
| Sales per Share Growth (1Y) | 15.55% |
| Sales per Share Growth (3Y) | 15.21% |
| Operating Cash Flow - Growth Rate (3Y) | 25.18% |
As of March 31, 2026
Fund Details
Top Portfolio Holders
| Name | % Weight |
|---|---|
| Portfolio A | 5.00% |
| Portfolio B | 3.50% |
| Portfolio C | 2.25% |
Excel Add-In Codes
| Name: =YCI("M:SUWCX", "name") |
| Broad Asset Class: =YCI("M:SUWCX", "broad_asset_class") |
| Broad Category: =YCI("M:SUWCX", "broad_category_group") |
| Prospectus Objective: =YCI("M:SUWCX", "prospectus_objective") |
| To find the codes for any of our securities and financial metrics, see our Complete Excel Reference. |