

Calvert US Large-Cap Core Responsible Index C (CSXCX)
55.67
+0.23
(+0.41%)
USD |
May 22 2026
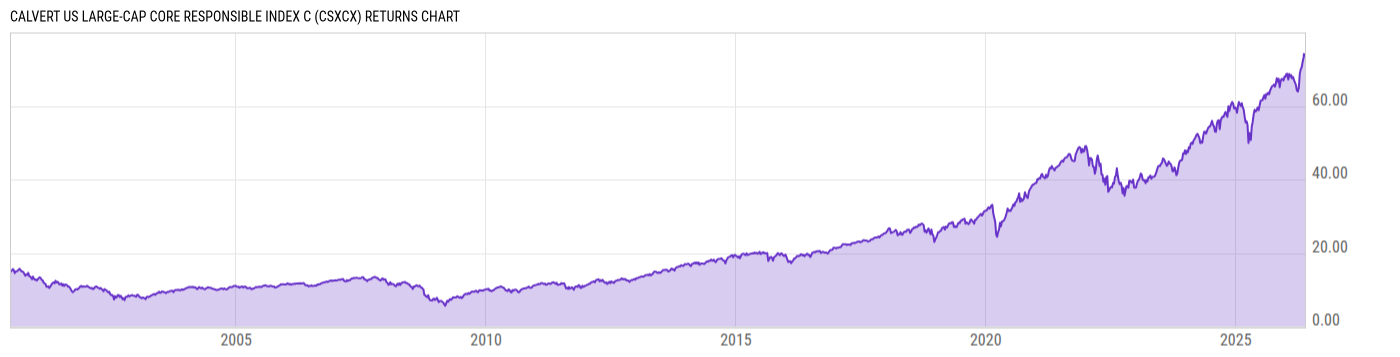
Returns Chart
Key Stats
| Net Expense Ratio | Total Assets Under Management | Weighted Average Dividend Yield | Turnover Ratio (Generic) |
|---|---|---|---|
| 1.24% | 6.186B | 1.17% | 8.00% |
| 1 Year Fund Level Flows | 1 Year Total Returns (Daily) | Annualized Total Returns Since Inception (Daily) | Max Drawdown (Since Inception) |
| -699.89M | 28.32% |
Basic Info
| Investment Strategy | |
| The Fund seeks to employ a passive management strategy designed to track, as closely as possible, the performance of the Calvert Social Index. Intends to use a replication index method, investing in each stock in the Index in about the same proportion as represented in the Index itself. |
| General | |
| Security Type | Mutual Fund |
| Equity Style | Multi Cap Core |
| Broad Asset Class | US Equity |
| Broad Category | Equity |
| Global Peer Group | Equity US |
| Peer Group | Multi-Cap Core Funds |
| Global Macro | Equity North America |
| US Macro | Multi-Cap Funds |
| YCharts Categorization | -- |
| YCharts Benchmark | -- |
| Prospectus Objective | Growth & Income Funds |
| Fund Owner Firm Name | Calvert |
| Broad Asset Class Benchmark Index | |
| ^SPXTR | 100.0% |
Net Fund Flows Versus Peer Group
1 Month
% Rank:
83
-2.567B
Peer Group Low
4.060B
Peer Group High
1 Year
% Rank:
90
-699.89M
-37.69B
Peer Group Low
40.70B
Peer Group High
3 Months
% Rank:
94
-637.71M
Peer Group Low
17.31B
Peer Group High
3 Years
% Rank:
84
-29.31B
Peer Group Low
86.13B
Peer Group High
6 Months
% Rank:
87
-1.164B
Peer Group Low
28.18B
Peer Group High
5 Years
% Rank:
80
-19.00B
Peer Group Low
102.57B
Peer Group High
YTD
% Rank:
90
-759.70M
Peer Group Low
23.44B
Peer Group High
10 Years
% Rank:
12
-55.10B
Peer Group Low
209.18B
Peer Group High
Date Unavailable
Risk
Performance Versus Peer Group
Annual Total Returns Versus Peers
As of May 24, 2026.
Asset Allocation
As of February 28, 2026.
| Type | % Net |
|---|---|
| Cash | 0.00% |
| Stock | 99.89% |
| Bond | 0.00% |
| Convertible | 0.00% |
| Preferred | 0.00% |
| Other | 0.11% |
Top 10 Holdings
| Name | % Weight | Price | % Change |
|---|---|---|---|
| NVIDIA Corp. | 6.69% | 215.33 | -1.90% |
| Apple, Inc. | 6.31% | 308.82 | 1.26% |
| Alphabet, Inc. | 5.48% | 382.97 | -1.21% |
| Microsoft Corp. | 4.67% | 418.57 | -0.12% |
| Amazon.com, Inc. | 3.35% | 266.32 | -0.80% |
| Broadcom Inc. | 2.46% | 414.14 | -0.10% |
| Eli Lilly & Co. | 1.56% | 1065.00 | 2.24% |
| JPMorgan Chase & Co. | 1.43% | 306.38 | 1.12% |
| Visa, Inc. | 1.00% | 328.88 | -0.68% |
| Walmart, Inc. | 0.98% | 120.27 | -0.88% |
Fees & Availability
| Fees | |
| Actual 12B-1 Fee | 1.00% |
| Actual Management Fee | 0.13% |
| Administration Fee | 88.30K% |
| Maximum Front Load | -- |
| Maximum Deferred Load | 1.00% |
| Maximum Redemption Fee | 0.00% |
| General Availability | |
| Available for Insurance Product | No |
| Available for RRSP | No |
| Purchase Details | |
| Open to New Investors |
|
| Minimum Initial Investment | 5000.00 None |
| Minimum Subsequent Investment | 0.00 None |
Basic Info
| Investment Strategy | |
| The Fund seeks to employ a passive management strategy designed to track, as closely as possible, the performance of the Calvert Social Index. Intends to use a replication index method, investing in each stock in the Index in about the same proportion as represented in the Index itself. |
| General | |
| Security Type | Mutual Fund |
| Equity Style | Multi Cap Core |
| Broad Asset Class | US Equity |
| Broad Category | Equity |
| Global Peer Group | Equity US |
| Peer Group | Multi-Cap Core Funds |
| Global Macro | Equity North America |
| US Macro | Multi-Cap Funds |
| YCharts Categorization | -- |
| YCharts Benchmark | -- |
| Prospectus Objective | Growth & Income Funds |
| Fund Owner Firm Name | Calvert |
| Broad Asset Class Benchmark Index | |
| ^SPXTR | 100.0% |
Fundamentals
| General | |
| Distribution Yield | -- |
| Dividend Yield TTM (5-21-26) | 0.06% |
| 30-Day SEC Yield (12-31-24) | 76.28M% |
| 7-Day SEC Yield | -- |
| Number of Holdings | 789 |
| Stock | |
| Weighted Average PE Ratio | 32.79 |
| Weighted Average Price to Sales Ratio | 7.874 |
| Weighted Average Price to Book Ratio | 10.87 |
| Weighted Median ROE | 121.7% |
| Weighted Median ROA | 16.26% |
| ROI (TTM) | 23.50% |
| Return on Investment (TTM) | 23.50% |
| Earning Yield | 0.0371 |
| LT Debt / Shareholders Equity | 0.8452 |
| Number of Equity Holdings | 785 |
As of February 28, 2026
Growth Metrics
| EPS Growth (1Y) | 23.57% |
| EPS Growth (3Y) | 20.38% |
| EPS Growth (5Y) | 23.79% |
| Sales Growth (1Y) | 14.64% |
| Sales Growth (3Y) | 14.76% |
| Sales Growth (5Y) | 15.18% |
| Sales per Share Growth (1Y) | 16.59% |
| Sales per Share Growth (3Y) | 15.43% |
| Operating Cash Flow - Growth Rate (3Y) | 26.12% |
As of February 28, 2026
Fund Details
Top Portfolio Holders
| Name | % Weight |
|---|---|
| Portfolio A | 5.00% |
| Portfolio B | 3.50% |
| Portfolio C | 2.25% |
Excel Add-In Codes
| Name: =YCI("M:CSXCX", "name") |
| Broad Asset Class: =YCI("M:CSXCX", "broad_asset_class") |
| Broad Category: =YCI("M:CSXCX", "broad_category_group") |
| Prospectus Objective: =YCI("M:CSXCX", "prospectus_objective") |
| To find the codes for any of our securities and financial metrics, see our Complete Excel Reference. |