

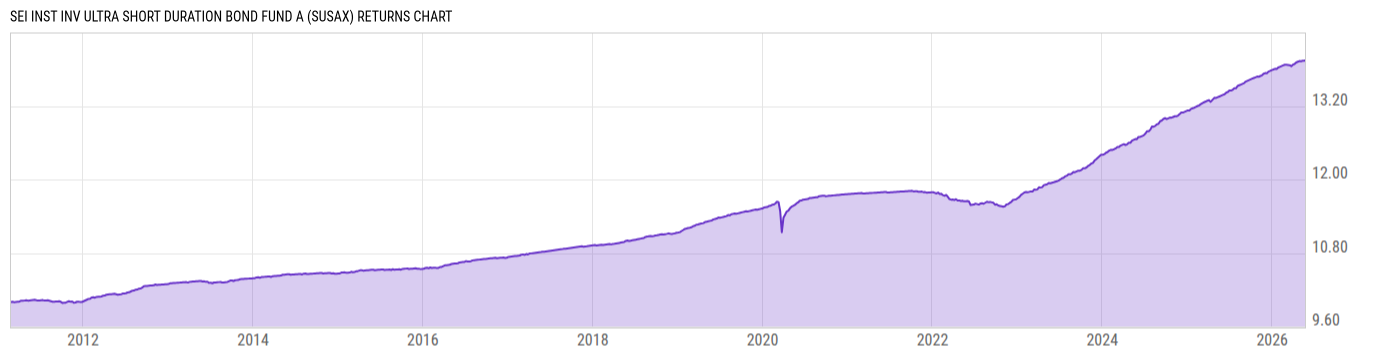
SEI Inst Inv Ultra Short Duration Bond Fund A (SUSAX)
9.95
0.00 (0.00%)
USD |
Jun 09 2026
Returns Chart
Key Stats
| Net Expense Ratio | Total Assets Under Management | Weighted Average Dividend Yield | Turnover Ratio (Generic) |
|---|---|---|---|
| 0.25% | 356.21M | -- | 77.00% |
| 1 Year Fund Level Flows | 1 Year Total Returns (Daily) | Annualized Total Returns Since Inception (Daily) | Max Drawdown (Since Inception) |
| -112.65M | 4.34% |
Basic Info
| Investment Strategy | |
| The Fund seeks higher current income than that typically offered by a money market fund while maintaining a high degree of liquidity and a correspondingly higher risk of principal volatility. The Fund may invest contracts, options, swaps and other similar instruments. |
| General | |
| Security Type | Mutual Fund |
| Equity Style | -- |
| Broad Asset Class | Taxable Bond |
| Broad Category | Fixed Income |
| Global Peer Group | Bond USD Short Term |
| Peer Group | Ultra-Short Obligations Funds |
| Global Macro | Bond Short Term |
| US Macro | Short/Intermediate Investment-Grade Funds |
| YCharts Categorization | -- |
| YCharts Benchmark | -- |
| Prospectus Objective | Ultra-Short Obligations Funds |
| Fund Owner Firm Name | SEI |
| Broad Asset Class Benchmark Index | |
| ^BBUSATR | 100.0% |
Net Fund Flows Versus Peer Group
1 Month
% Rank:
71
-505.30M
Peer Group Low
1.030B
Peer Group High
1 Year
% Rank:
89
-112.65M
-1.377B
Peer Group Low
6.882B
Peer Group High
3 Months
% Rank:
70
-934.15M
Peer Group Low
2.819B
Peer Group High
3 Years
% Rank:
56
-2.738B
Peer Group Low
10.11B
Peer Group High
6 Months
% Rank:
60
-943.83M
Peer Group Low
4.167B
Peer Group High
5 Years
% Rank:
57
-10.77B
Peer Group Low
16.65B
Peer Group High
YTD
% Rank:
64
-834.63M
Peer Group Low
3.692B
Peer Group High
10 Years
% Rank:
87
-5.237B
Peer Group Low
33.03B
Peer Group High
Date Unavailable
Risk
Performance Versus Peer Group
Annual Total Returns Versus Peers
As of June 10, 2026.
Asset Allocation
As of April 30, 2026.
| Type | % Net |
|---|---|
| Cash | 2.65% |
| Stock | 0.00% |
| Bond | 46.85% |
| Convertible | 0.00% |
| Preferred | 0.00% |
| Other | 50.50% |
Top 10 Holdings
| Name | % Weight | Price | % Change |
|---|---|---|---|
|
Other Assets less Liabilities
|
48.17% | -- | -- |
| United States of America USGB 3.5 10/15/2028 FIX USD Government | 2.67% | 98.51 | -0.02% |
| United States of America USGB 3.375 12/31/2027 FIX USD Government | 2.21% | 98.90 | 0.01% |
|
2YR T-NOTE JUN26
|
1.54% | -- | -- |
|
5YR T NOTE JUN26
|
1.24% | -- | -- |
|
BNP Paribas SA Repo
|
0.99% | -- | -- |
|
Barclays Capital Inc REPO
|
0.96% | -- | -- |
|
ARES CLO LTD 34R4 A1R FLT 4.95763% 19-JUL-2038
|
0.55% | -- | -- |
|
FEDERAL HOME LOAN MORTGAGE CORPORATION S431 LB PT FIX 4% 25-APR-2027
|
0.50% | -- | -- |
|
BAIN CAPITAL CREDIT CLO 192RRR AR3 SEQ FLT 4.58763% 18-OCT-2032
|
0.48% | -- | -- |
Fees & Availability
| Fees | |
| Actual 12B-1 Fee | -- |
| Actual Management Fee | 0.15% |
| Administration Fee | -1.00K% |
| Maximum Front Load | -- |
| Maximum Deferred Load | -- |
| Maximum Redemption Fee | -- |
| General Availability | |
| Available for Insurance Product | No |
| Available for RRSP | No |
| Purchase Details | |
| Open to New Investors |
|
| Minimum Initial Investment | 100000.0 None |
| Minimum Subsequent Investment | 1000.00 None |
Basic Info
| Investment Strategy | |
| The Fund seeks higher current income than that typically offered by a money market fund while maintaining a high degree of liquidity and a correspondingly higher risk of principal volatility. The Fund may invest contracts, options, swaps and other similar instruments. |
| General | |
| Security Type | Mutual Fund |
| Equity Style | -- |
| Broad Asset Class | Taxable Bond |
| Broad Category | Fixed Income |
| Global Peer Group | Bond USD Short Term |
| Peer Group | Ultra-Short Obligations Funds |
| Global Macro | Bond Short Term |
| US Macro | Short/Intermediate Investment-Grade Funds |
| YCharts Categorization | -- |
| YCharts Benchmark | -- |
| Prospectus Objective | Ultra-Short Obligations Funds |
| Fund Owner Firm Name | SEI |
| Broad Asset Class Benchmark Index | |
| ^BBUSATR | 100.0% |
Fundamentals
| General | |
| Distribution Yield | -- |
| Dividend Yield TTM (6-8-26) | 4.39% |
| 30-Day SEC Yield (5-31-26) | 4.09% |
| 7-Day SEC Yield | -- |
| Number of Holdings | 320 |
Fund Details
| Key Dates | |
| Inception Date | 2/25/2011 |
| Last Annual Report Date | 5/31/2025 |
| Last Prospectus Date | 9/30/2025 |
| Attributes | |
| Index Fund | -- |
| Inverse Fund | No |
| Leveraged Fund | -- |
| Fund of Funds | No |
| Currency Hedged Fund | -- |
| Socially Responsible Fund | No |
Top Portfolio Holders
| Name | % Weight |
|---|---|
| Portfolio A | 5.00% |
| Portfolio B | 3.50% |
| Portfolio C | 2.25% |
Excel Add-In Codes
| Name: =YCI("M:SUSAX", "name") |
| Broad Asset Class: =YCI("M:SUSAX", "broad_asset_class") |
| Broad Category: =YCI("M:SUSAX", "broad_category_group") |
| Prospectus Objective: =YCI("M:SUSAX", "prospectus_objective") |
| To find the codes for any of our securities and financial metrics, see our Complete Excel Reference. |