

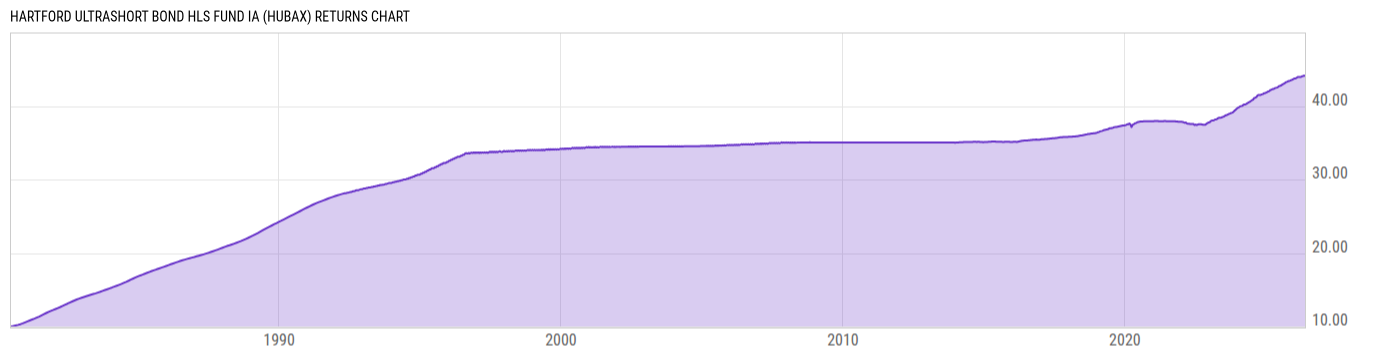
Hartford Ultrashort Bond HLS Fund IA (HUBAX)
10.45
+0.01
(+0.10%)
USD |
Jun 09 2026
Returns Chart
Key Stats
| Net Expense Ratio | Total Assets Under Management | Weighted Average Dividend Yield | Turnover Ratio (Generic) |
|---|---|---|---|
| 0.45% | 469.13M | -- | 70.00% |
| 1 Year Fund Level Flows | 1 Year Total Returns (Daily) | Annualized Total Returns Since Inception (Daily) | Max Drawdown (Since Inception) |
| -60.50M | 3.82% |
Basic Info
| Investment Strategy | |
| The Fund seeks to provide total return and income consistent with preserving capital and maintaining liquidity. Under normal circumstances, the Fund invests at least 80% of its assets in fixed income securities. The Fund normally will maintain a dollar weighted average duration of less than 1.5 years. |
| General | |
| Security Type | Insurance Fund |
| Equity Style | -- |
| Broad Asset Class | Taxable Bond |
| Broad Category | Fixed Income |
| Global Peer Group | Bond USD Short Term |
| Peer Group | Ultra-Short Obligations Funds |
| Global Macro | Bond Short Term |
| US Macro | Short/Intermediate Investment-Grade Funds |
| YCharts Categorization | -- |
| YCharts Benchmark | -- |
| Prospectus Objective | Ultra-Short Obligations Funds |
| Fund Owner Firm Name | Hartford Funds |
| Broad Asset Class Benchmark Index | |
| ^BBUSATR | 100.0% |
Net Fund Flows Versus Peer Group
1 Month
% Rank:
70
-505.30M
Peer Group Low
1.030B
Peer Group High
1 Year
% Rank:
82
-60.50M
-1.377B
Peer Group Low
6.882B
Peer Group High
3 Months
% Rank:
73
-934.15M
Peer Group Low
2.819B
Peer Group High
3 Years
% Rank:
77
-2.738B
Peer Group Low
10.11B
Peer Group High
6 Months
% Rank:
73
-943.83M
Peer Group Low
4.167B
Peer Group High
5 Years
% Rank:
54
-10.77B
Peer Group Low
16.65B
Peer Group High
YTD
% Rank:
74
-834.63M
Peer Group Low
3.692B
Peer Group High
10 Years
% Rank:
92
-5.237B
Peer Group Low
33.03B
Peer Group High
Date Unavailable
Risk
Performance Versus Peer Group
Annual Total Returns Versus Peers
As of June 10, 2026.
Asset Allocation
As of March 31, 2026.
| Type | % Net |
|---|---|
| Cash | 2.66% |
| Stock | 0.00% |
| Bond | 96.87% |
| Convertible | 0.00% |
| Preferred | 0.00% |
| Other | 0.47% |
Top 10 Holdings
| Name | % Weight | Price | % Change |
|---|---|---|---|
| United States of America USGB 3.625 08/31/2027 FIX USD Government | 7.31% | 99.50 | 0.01% |
| United States of America USGB 2.875 08/15/2028 FIX USD Government | 4.27% | 97.37 | 0.07% |
| United States of America USGB 1.375 08/31/2026 FIX USD Government | 4.05% | 99.48 | 0.01% |
|
Other Assets less Liabilities
|
2.08% | -- | -- |
|
GOVERNMENT NATIONAL MORTGAGE ASSOCIATION 2340H EA SEQ FIX 4.5% 20-NOV-2043
|
1.25% | -- | -- |
| Federal Home Loan Banks FHLB 4.0 03/25/2027 FIX USD Agency | 1.05% | 99.89 | 0.03% |
| United States of America USGB 3.375 12/31/2027 FIX USD Government | 1.03% | 98.89 | 0.03% |
| United States of America USGB 3.375 02/29/2028 FIX USD Government | 1.01% | 98.78 | 0.04% |
|
FEDERAL HOME LOAN MORTGAGE CORPORATION S431 LB PT FIX 4% 25-APR-2027
|
1.01% | -- | -- |
|
CAPITAL ONE PRIME AUTO RECEIVABLES TRUST 251 A2A FIX 3.88% 16-JAN-2029
|
0.97% | -- | -- |
Fees & Availability
| Fees | |
| Actual 12B-1 Fee | -- |
| Actual Management Fee | 0.40% |
| Administration Fee | -- |
| Maximum Front Load | -- |
| Maximum Deferred Load | -- |
| Maximum Redemption Fee | -- |
| General Availability | |
| Available for Insurance Product |
|
| Available for RRSP | No |
| Purchase Details | |
| Open to New Investors |
|
| Minimum Initial Investment | 0.00 None |
| Minimum Subsequent Investment | 0.00 None |
Basic Info
| Investment Strategy | |
| The Fund seeks to provide total return and income consistent with preserving capital and maintaining liquidity. Under normal circumstances, the Fund invests at least 80% of its assets in fixed income securities. The Fund normally will maintain a dollar weighted average duration of less than 1.5 years. |
| General | |
| Security Type | Insurance Fund |
| Equity Style | -- |
| Broad Asset Class | Taxable Bond |
| Broad Category | Fixed Income |
| Global Peer Group | Bond USD Short Term |
| Peer Group | Ultra-Short Obligations Funds |
| Global Macro | Bond Short Term |
| US Macro | Short/Intermediate Investment-Grade Funds |
| YCharts Categorization | -- |
| YCharts Benchmark | -- |
| Prospectus Objective | Ultra-Short Obligations Funds |
| Fund Owner Firm Name | Hartford Funds |
| Broad Asset Class Benchmark Index | |
| ^BBUSATR | 100.0% |
Fundamentals
| General | |
| Distribution Yield | -- |
| Dividend Yield TTM (6-8-26) | 5.18% |
| 30-Day SEC Yield (5-31-26) | 3.65% |
| 7-Day SEC Yield | -- |
| Number of Holdings | 307 |
| Bond | |
| Yield to Maturity (3-31-26) | -- |
| Effective Duration | -- |
| Average Coupon | -- |
| Calculated Average Quality | -- |
| Effective Maturity | -- |
| Nominal Maturity | -- |
| Number of Bond Holdings | 277 |
As of March 31, 2026
Fund Details
| Key Dates | |
| Launch Date | 6/30/1980 |
| Last Annual Report Date | 12/31/2025 |
| Last Prospectus Date | 4/30/2026 |
| Share Classes | |
| HUBBX | Other |
| LP40098181 | Other |
| Attributes | |
| Index Fund | -- |
| Inverse Fund | No |
| Leveraged Fund | -- |
| Fund of Funds | No |
| Currency Hedged Fund | -- |
| Socially Responsible Fund | No |
Top Portfolio Holders
| Name | % Weight |
|---|---|
| Portfolio A | 5.00% |
| Portfolio B | 3.50% |
| Portfolio C | 2.25% |