

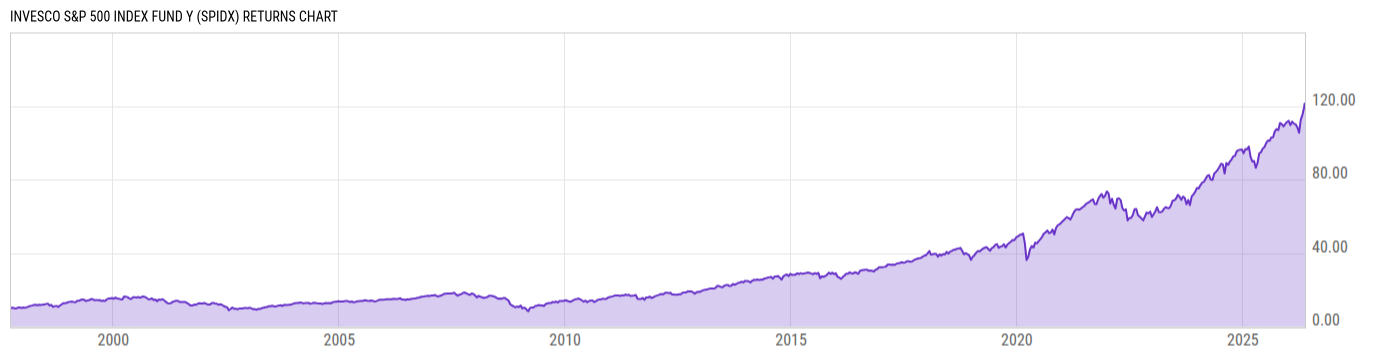
Invesco S&P 500 Index Fund Y (SPIDX)
79.22
-0.21
(-0.26%)
USD |
Jun 09 2026
Returns Chart
Key Stats
| Net Expense Ratio | Total Assets Under Management | Weighted Average Dividend Yield | Turnover Ratio (Generic) |
|---|---|---|---|
| 0.29% | 4.659B | 1.08% | 2.00% |
| 1 Year Fund Level Flows | 1 Year Total Returns (Daily) | Annualized Total Returns Since Inception (Daily) | Max Drawdown (Since Inception) |
| 187.98M | 24.16% |
Basic Info
| Investment Strategy | |
| The Fund seeks total return through growth of capital and current income. The Fund invests in common stocks of companies included in the S&P 500 Index, comprised of common stocks of approximately 500 large-capitalization companies that generally represent the large-cap segment of the U.S. equity market. |
| General | |
| Security Type | Mutual Fund |
| Equity Style | Large Cap Core |
| Broad Asset Class | US Equity |
| Broad Category | Equity |
| Global Peer Group | Equity US |
| Peer Group | S&P 500 Index Funds |
| Global Macro | Equity North America |
| US Macro | Large-Cap Funds |
| YCharts Categorization | -- |
| YCharts Benchmark | -- |
| Prospectus Objective | S&P 500 Index Objective Funds |
| Fund Owner Firm Name | Invesco |
| Broad Asset Class Benchmark Index | |
| ^SPXTR | 100.0% |
Net Fund Flows Versus Peer Group
1 Month
% Rank:
22
-4.774B
Peer Group Low
15.87B
Peer Group High
1 Year
% Rank:
18
187.98M
-106.57B
Peer Group Low
85.55B
Peer Group High
3 Months
% Rank:
23
-12.33B
Peer Group Low
33.28B
Peer Group High
3 Years
% Rank:
19
-73.33B
Peer Group Low
196.74B
Peer Group High
6 Months
% Rank:
23
-20.15B
Peer Group Low
59.75B
Peer Group High
5 Years
% Rank:
20
-120.47B
Peer Group Low
220.93B
Peer Group High
YTD
% Rank:
29
-16.06B
Peer Group Low
55.91B
Peer Group High
10 Years
% Rank:
23
-229.40B
Peer Group Low
329.91B
Peer Group High
Date Unavailable
Risk
Performance Versus Peer Group
Annual Total Returns Versus Peers
As of June 10, 2026.
Asset Allocation
As of April 30, 2026.
| Type | % Net |
|---|---|
| Cash | -1.28% |
| Stock | 97.05% |
| Bond | 1.25% |
| Convertible | 0.00% |
| Preferred | 0.00% |
| Other | 2.98% |
Top 10 Holdings
| Name | % Weight | Price | % Change |
|---|---|---|---|
| NVIDIA Corp. | 7.62% | 208.19 | -0.22% |
| Apple, Inc. | 6.26% | 290.55 | -3.64% |
| Microsoft Corp. | 4.76% | 403.41 | -2.02% |
| Amazon.com, Inc. | 4.07% | 244.19 | -0.42% |
| Alphabet, Inc. | 3.52% | 364.26 | 0.26% |
| Broadcom Inc. | 3.11% | 392.16 | -1.12% |
|
EMINI S&P JUN26
|
2.98% | -- | -- |
| Alphabet, Inc. | 2.81% | 362.29 | 0.31% |
| Meta Platforms, Inc. | 2.10% | 584.59 | -0.14% |
| Invesco Treasury Portfolio Institutional | 1.88% | 1.00 | 0.00% |
Fees & Availability
| Fees | |
| Actual 12B-1 Fee | -- |
| Actual Management Fee | 0.11% |
| Administration Fee | -- |
| Maximum Front Load | -- |
| Maximum Deferred Load | -- |
| Maximum Redemption Fee | 0.00% |
| General Availability | |
| Available for Insurance Product | No |
| Available for RRSP | No |
| Purchase Details | |
| Open to New Investors |
|
| Minimum Initial Investment | 1000.00 None |
| Minimum Subsequent Investment | 50.00 None |
Basic Info
| Investment Strategy | |
| The Fund seeks total return through growth of capital and current income. The Fund invests in common stocks of companies included in the S&P 500 Index, comprised of common stocks of approximately 500 large-capitalization companies that generally represent the large-cap segment of the U.S. equity market. |
| General | |
| Security Type | Mutual Fund |
| Equity Style | Large Cap Core |
| Broad Asset Class | US Equity |
| Broad Category | Equity |
| Global Peer Group | Equity US |
| Peer Group | S&P 500 Index Funds |
| Global Macro | Equity North America |
| US Macro | Large-Cap Funds |
| YCharts Categorization | -- |
| YCharts Benchmark | -- |
| Prospectus Objective | S&P 500 Index Objective Funds |
| Fund Owner Firm Name | Invesco |
| Broad Asset Class Benchmark Index | |
| ^SPXTR | 100.0% |
Fundamentals
| General | |
| Distribution Yield | -- |
| Dividend Yield TTM (6-8-26) | 0.74% |
| 30-Day SEC Yield | -- |
| 7-Day SEC Yield | -- |
| Number of Holdings | 509 |
| Stock | |
| Weighted Average PE Ratio | 32.88 |
| Weighted Average Price to Sales Ratio | 9.392 |
| Weighted Average Price to Book Ratio | 11.66 |
| Weighted Median ROE | 106.6% |
| Weighted Median ROA | 18.80% |
| ROI (TTM) | 26.83% |
| Return on Investment (TTM) | 26.83% |
| Earning Yield | 0.0371 |
| LT Debt / Shareholders Equity | 0.7615 |
| Number of Equity Holdings | 505 |
As of April 30, 2026
Growth Metrics
| EPS Growth (1Y) | 27.85% |
| EPS Growth (3Y) | 21.59% |
| EPS Growth (5Y) | 25.79% |
| Sales Growth (1Y) | 15.85% |
| Sales Growth (3Y) | 15.63% |
| Sales Growth (5Y) | 16.29% |
| Sales per Share Growth (1Y) | 16.59% |
| Sales per Share Growth (3Y) | 16.15% |
| Operating Cash Flow - Growth Rate (3Y) | 25.71% |
As of April 30, 2026
Fund Details
Top Portfolio Holders
| Name | % Weight |
|---|---|
| Portfolio A | 5.00% |
| Portfolio B | 3.50% |
| Portfolio C | 2.25% |
Excel Add-In Codes
| Name: =YCI("M:SPIDX", "name") |
| Broad Asset Class: =YCI("M:SPIDX", "broad_asset_class") |
| Broad Category: =YCI("M:SPIDX", "broad_category_group") |
| Prospectus Objective: =YCI("M:SPIDX", "prospectus_objective") |
| To find the codes for any of our securities and financial metrics, see our Complete Excel Reference. |