

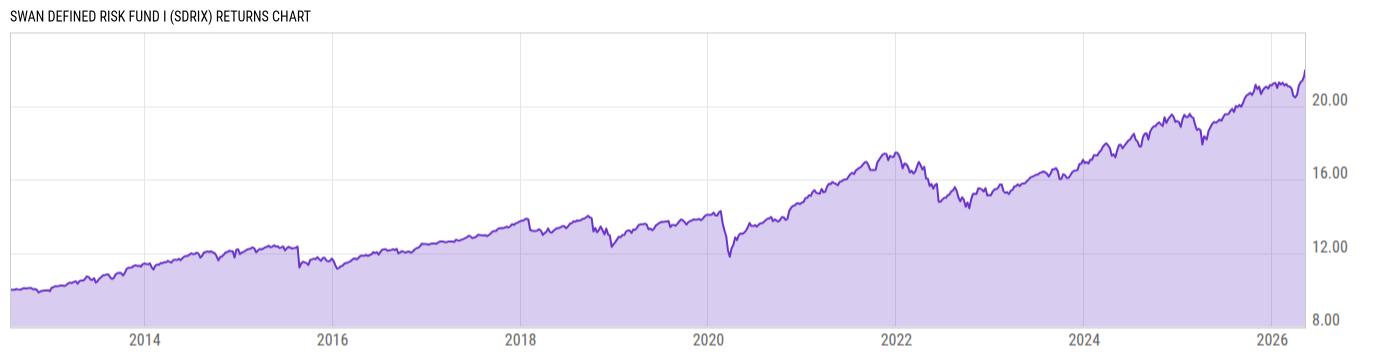
Swan Defined Risk Fund I (SDRIX)
15.68
+0.04
(+0.26%)
USD |
May 29 2026
Returns Chart
Key Stats
| Net Expense Ratio | Total Assets Under Management | Weighted Average Dividend Yield | Turnover Ratio (Generic) |
|---|---|---|---|
| 1.25% | 604.10M | -- | 12.00% |
| 1 Year Fund Level Flows | 1 Year Total Returns (Daily) | Annualized Total Returns Since Inception (Daily) | Max Drawdown (Since Inception) |
| -133.09M | 17.16% |
Basic Info
| Investment Strategy | |
| The Fund seeks income and growth of capital. The Fund invest primarily in equity securities of large capitalization US companies through ETFs that invest in equity securities and exchange-traded long-term put options represented in S&P 500 Index, and buying and selling exchange-traded put and call options. |
| General | |
| Security Type | Mutual Fund |
| Equity Style | -- |
| Broad Asset Class | US Equity |
| Broad Category | Equity |
| Global Peer Group | Equity Other |
| Peer Group | Specialty Diversified Equity Funds |
| Global Macro | Equity Other |
| US Macro | Large-Cap Funds |
| YCharts Categorization | -- |
| YCharts Benchmark | -- |
| Prospectus Objective | Growth & Income Funds |
| Fund Owner Firm Name | Swan Capital Management |
| Broad Asset Class Benchmark Index | |
| ^SPXTR | 100.0% |
Net Fund Flows Versus Peer Group
1 Month
% Rank:
91
-24.02M
Peer Group Low
-23116.00
Peer Group High
1 Year
% Rank:
82
-133.09M
-146.46M
Peer Group Low
9.237M
Peer Group High
3 Months
% Rank:
91
-42.59M
Peer Group Low
-593924.0
Peer Group High
3 Years
% Rank:
82
-517.12M
Peer Group Low
17.07M
Peer Group High
6 Months
% Rank:
91
-72.56M
Peer Group Low
5.112M
Peer Group High
5 Years
% Rank:
91
-752.72M
Peer Group Low
17.07M
Peer Group High
YTD
% Rank:
91
-51.85M
Peer Group Low
-500080.0
Peer Group High
10 Years
% Rank:
91
-1.692B
Peer Group Low
70.36M
Peer Group High
Date Unavailable
Risk
Performance Versus Peer Group
Annual Total Returns Versus Peers
As of May 30, 2026.
Asset Allocation
As of December 31, 2025.
| Type | % Net |
|---|---|
| Cash | -0.10% |
| Stock | 89.02% |
| Bond | 0.06% |
| Convertible | 0.00% |
| Preferred | 0.00% |
| Other | 11.02% |
Top 10 Holdings
| Name | % Weight | Price | % Change |
|---|---|---|---|
| iShares Core S&P 500 ETF | 60.71% | 760.24 | 0.27% |
| State Street Technology Select Sector SPDR ETF | 9.87% | 191.01 | 2.23% |
|
SPX Dec7 7250.0P
|
4.59% | -- | -- |
|
SPX Dec7 7350.0P
|
4.48% | -- | -- |
| State Street Financial Sel Sec SPDR ETF | 3.82% | 51.57 | 0.59% |
| State Street Consumer Disc Sel Sect SPDR ETF | 2.97% | 120.90 | -0.95% |
| State Street Health Care Select Sector SPDR ETF | 2.80% | 149.54 | -0.89% |
| State Street Com Svc Sel Sec SPDR ETF | 2.79% | 115.73 | -0.81% |
| State Street Industrial Select Sector SPDR ETF | 2.37% | 173.16 | -0.37% |
|
Other Assets less Liabilities
|
1.87% | -- | -- |
Fees & Availability
| Fees | |
| Actual 12B-1 Fee | -- |
| Actual Management Fee | 1.00% |
| Administration Fee | 327.7K% |
| Maximum Front Load | -- |
| Maximum Deferred Load | -- |
| Maximum Redemption Fee | 0.00% |
| General Availability | |
| Available for Insurance Product | No |
| Available for RRSP | No |
| Purchase Details | |
| Open to New Investors |
|
| Minimum Initial Investment | 100000.0 None |
| Minimum Subsequent Investment | 500.00 None |
Basic Info
| Investment Strategy | |
| The Fund seeks income and growth of capital. The Fund invest primarily in equity securities of large capitalization US companies through ETFs that invest in equity securities and exchange-traded long-term put options represented in S&P 500 Index, and buying and selling exchange-traded put and call options. |
| General | |
| Security Type | Mutual Fund |
| Equity Style | -- |
| Broad Asset Class | US Equity |
| Broad Category | Equity |
| Global Peer Group | Equity Other |
| Peer Group | Specialty Diversified Equity Funds |
| Global Macro | Equity Other |
| US Macro | Large-Cap Funds |
| YCharts Categorization | -- |
| YCharts Benchmark | -- |
| Prospectus Objective | Growth & Income Funds |
| Fund Owner Firm Name | Swan Capital Management |
| Broad Asset Class Benchmark Index | |
| ^SPXTR | 100.0% |
Fundamentals
| General | |
| Distribution Yield | -- |
| Dividend Yield TTM (5-28-26) | 0.09% |
| 30-Day SEC Yield | -- |
| 7-Day SEC Yield | -- |
| Number of Holdings | 29 |
| Stock | |
| Weighted Average PE Ratio | 33.80 |
| Weighted Average Price to Sales Ratio | 8.726 |
| Weighted Average Price to Book Ratio | 11.40 |
| Weighted Median ROE | 64.72% |
| Weighted Median ROA | 16.89% |
| ROI (TTM) | 26.29% |
| Return on Investment (TTM) | 26.29% |
| Earning Yield | 0.0370 |
| LT Debt / Shareholders Equity | 1.062 |
| Number of Equity Holdings | 0 |
As of December 31, 2025
Growth Metrics
| EPS Growth (1Y) | 29.95% |
| EPS Growth (3Y) | 16.87% |
| EPS Growth (5Y) | 21.83% |
| Sales Growth (1Y) | 16.12% |
| Sales Growth (3Y) | 13.48% |
| Sales Growth (5Y) | 15.22% |
| Sales per Share Growth (1Y) | 19.78% |
| Sales per Share Growth (3Y) | 14.08% |
| Operating Cash Flow - Growth Rate (3Y) | 17.24% |
As of December 31, 2025
Fund Details
Top Portfolio Holders
| Name | % Weight |
|---|---|
| Portfolio A | 5.00% |
| Portfolio B | 3.50% |
| Portfolio C | 2.25% |
Excel Add-In Codes
| Name: =YCI("M:SDRIX", "name") |
| Broad Asset Class: =YCI("M:SDRIX", "broad_asset_class") |
| Broad Category: =YCI("M:SDRIX", "broad_category_group") |
| Prospectus Objective: =YCI("M:SDRIX", "prospectus_objective") |
| To find the codes for any of our securities and financial metrics, see our Complete Excel Reference. |