

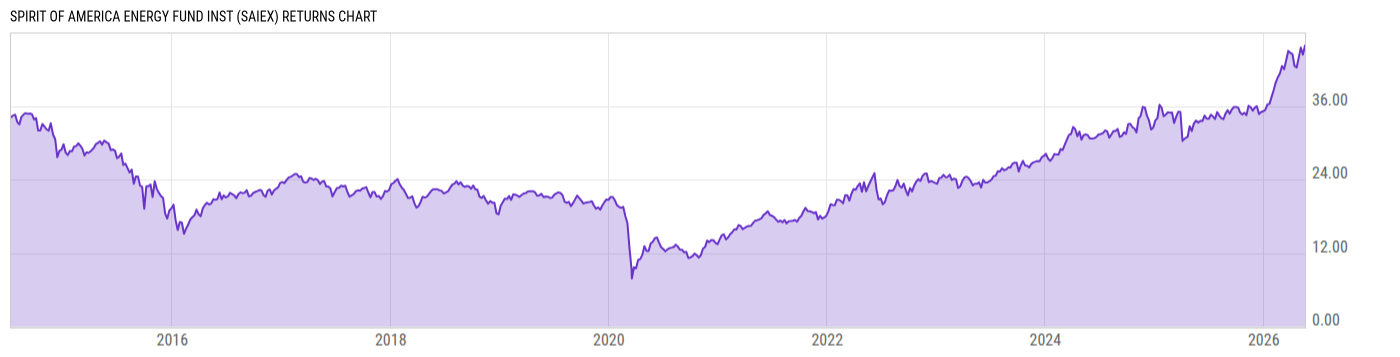
Spirit of America Energy Fund Inst (SAIEX)
10.69
-0.14
(-1.29%)
USD |
Jun 09 2026
Returns Chart
Key Stats
| Net Expense Ratio | Total Assets Under Management | Weighted Average Dividend Yield | Turnover Ratio (Generic) |
|---|---|---|---|
| 1.28% | 159.85M | 2.46% | 6.00% |
| 1 Year Fund Level Flows | 1 Year Total Returns (Daily) | Annualized Total Returns Since Inception (Daily) | Max Drawdown (Since Inception) |
| -51.12M | 31.40% |
Basic Info
| Investment Strategy | |
| The Fund seeks to provide investors long-term capital appreciation and current income. The Fund will be investing at least 80% of its net assets in a combination of securities and other assets of energy, energy related companies and companies which are principally engaged in activities in the energy industry. |
| General | |
| Security Type | Mutual Fund |
| Equity Style | Multi Cap Value |
| Broad Asset Class | Sector Equity |
| Broad Category | Equity |
| Global Peer Group | Equity Sector Energy |
| Peer Group | Energy MLP Funds |
| Global Macro | Equity Industry Sector |
| US Macro | Sector Equity Funds |
| YCharts Categorization | -- |
| YCharts Benchmark | -- |
| Prospectus Objective | Energy MLP Funds |
| Fund Owner Firm Name | Spirit of America Investment Funds |
| Broad Asset Class Benchmark Index | |
| ^MSWNTR | 100.0% |
Net Fund Flows Versus Peer Group
1 Month
% Rank:
62
-138.04M
Peer Group Low
174.91M
Peer Group High
1 Year
% Rank:
42
-51.12M
-303.08M
Peer Group Low
603.68M
Peer Group High
3 Months
% Rank:
42
-99.09M
Peer Group Low
306.82M
Peer Group High
3 Years
% Rank:
49
-779.05M
Peer Group Low
1.264B
Peer Group High
6 Months
% Rank:
41
-155.80M
Peer Group Low
603.68M
Peer Group High
5 Years
% Rank:
56
-1.420B
Peer Group Low
1.164B
Peer Group High
YTD
% Rank:
46
-126.55M
Peer Group Low
576.69M
Peer Group High
10 Years
% Rank:
50
-2.992B
Peer Group Low
1.824B
Peer Group High
Date Unavailable
Risk
Performance Versus Peer Group
Annual Total Returns Versus Peers
As of June 10, 2026.
Asset Allocation
As of March 31, 2026.
| Type | % Net |
|---|---|
| Cash | 0.06% |
| Stock | 85.31% |
| Bond | 0.03% |
| Convertible | 0.00% |
| Preferred | 0.00% |
| Other | 14.60% |
Top 10 Holdings
| Name | % Weight | Price | % Change |
|---|---|---|---|
| Valero Energy Corp. | 5.66% | 257.10 | 1.31% |
| Marathon Petroleum Corp. | 5.20% | 264.75 | 2.56% |
| The Williams Cos., Inc. | 5.06% | 72.78 | 1.66% |
| Targa Resources Corp. | 4.58% | 271.24 | 2.67% |
| Phillips 66 | 4.56% | 182.99 | 2.23% |
| Exxon Mobil Corp. | 4.22% | 151.62 | 1.82% |
| Kinder Morgan, Inc. | 4.22% | 31.93 | 1.88% |
| Chevron Corp. | 4.19% | 191.02 | 2.28% |
| Cheniere Energy, Inc. | 4.05% | 244.24 | 2.02% |
| Enbridge, Inc. | 3.69% | 56.47 | 1.67% |
Fees & Availability
| Fees | |
| Actual 12B-1 Fee | -- |
| Actual Management Fee | 0.95% |
| Administration Fee | -- |
| Maximum Front Load | -- |
| Maximum Deferred Load | -- |
| Maximum Redemption Fee | -- |
| General Availability | |
| Available for Insurance Product | No |
| Available for RRSP | No |
| Purchase Details | |
| Open to New Investors |
|
| Minimum Initial Investment | 100000.0 None |
| Minimum Subsequent Investment | 10000.00 None |
Basic Info
| Investment Strategy | |
| The Fund seeks to provide investors long-term capital appreciation and current income. The Fund will be investing at least 80% of its net assets in a combination of securities and other assets of energy, energy related companies and companies which are principally engaged in activities in the energy industry. |
| General | |
| Security Type | Mutual Fund |
| Equity Style | Multi Cap Value |
| Broad Asset Class | Sector Equity |
| Broad Category | Equity |
| Global Peer Group | Equity Sector Energy |
| Peer Group | Energy MLP Funds |
| Global Macro | Equity Industry Sector |
| US Macro | Sector Equity Funds |
| YCharts Categorization | -- |
| YCharts Benchmark | -- |
| Prospectus Objective | Energy MLP Funds |
| Fund Owner Firm Name | Spirit of America Investment Funds |
| Broad Asset Class Benchmark Index | |
| ^MSWNTR | 100.0% |
Fundamentals
| General | |
| Distribution Yield | -- |
| Dividend Yield TTM (6-8-26) | 14.32% |
| 30-Day SEC Yield | -- |
| 7-Day SEC Yield | -- |
| Number of Holdings | 69 |
| Stock | |
| Weighted Average PE Ratio | 24.56 |
| Weighted Average Price to Sales Ratio | 3.520 |
| Weighted Average Price to Book Ratio | 5.360 |
| Weighted Median ROE | 21.54% |
| Weighted Median ROA | 6.65% |
| ROI (TTM) | 8.01% |
| Return on Investment (TTM) | 8.01% |
| Earning Yield | 0.0483 |
| LT Debt / Shareholders Equity | 1.353 |
| Number of Equity Holdings | 56 |
As of March 31, 2026
Growth Metrics
| EPS Growth (1Y) | 17.10% |
| EPS Growth (3Y) | -1.44% |
| EPS Growth (5Y) | 24.72% |
| Sales Growth (1Y) | 7.19% |
| Sales Growth (3Y) | -2.96% |
| Sales Growth (5Y) | 14.33% |
| Sales per Share Growth (1Y) | 6.56% |
| Sales per Share Growth (3Y) | -2.54% |
| Operating Cash Flow - Growth Rate (3Y) | -0.27% |
As of March 31, 2026
Fund Details
Top Portfolio Holders
| Name | % Weight |
|---|---|
| Portfolio A | 5.00% |
| Portfolio B | 3.50% |
| Portfolio C | 2.25% |
Excel Add-In Codes
| Name: =YCI("M:SAIEX", "name") |
| Broad Asset Class: =YCI("M:SAIEX", "broad_asset_class") |
| Broad Category: =YCI("M:SAIEX", "broad_category_group") |
| Prospectus Objective: =YCI("M:SAIEX", "prospectus_objective") |
| To find the codes for any of our securities and financial metrics, see our Complete Excel Reference. |