

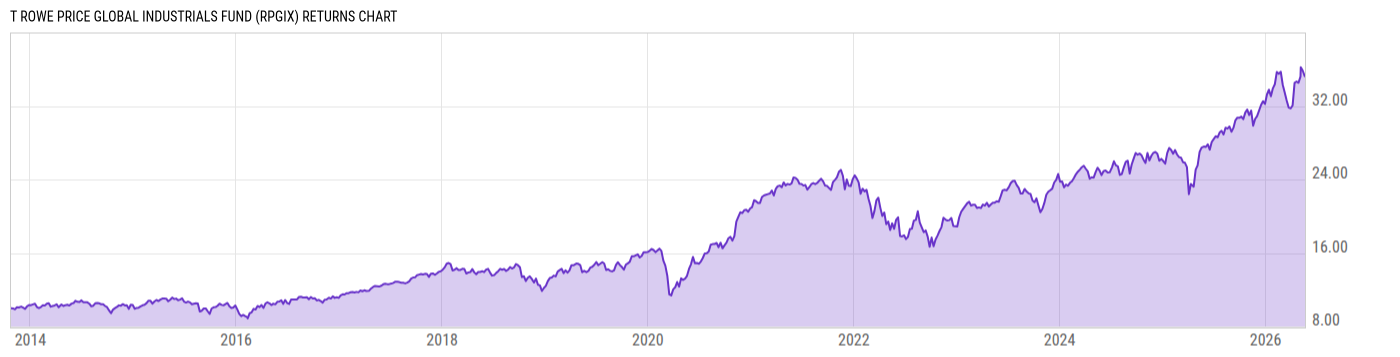
T Rowe Price Global Industrials Fund (RPGIX)
25.26
+0.04
(+0.16%)
USD |
May 21 2026
Returns Chart
Key Stats
| Net Expense Ratio | Total Assets Under Management | Weighted Average Dividend Yield | Turnover Ratio (Generic) |
|---|---|---|---|
| 1.05% | 171.15M | 1.17% | 85.00% |
| 1 Year Fund Level Flows | 1 Year Total Returns (Daily) | Annualized Total Returns Since Inception (Daily) | Max Drawdown (Since Inception) |
| -14.78M | 30.86% |
Basic Info
| Investment Strategy | |
| The Fund seeks to provide long-term growth of capital. The Fund invests at least 80% its net assets in securities issued by companies in the industrials sector and at least 40% of its net assets in securities issued by companies organized or located outside the US or doing a substantial amount of business outside the US. |
| General | |
| Security Type | Mutual Fund |
| Equity Style | Multi Cap Core |
| Broad Asset Class | Sector Equity |
| Broad Category | Equity |
| Global Peer Group | Equity Sector Industrials |
| Peer Group | Industrials Funds |
| Global Macro | Equity Industry Sector |
| US Macro | Sector Equity Funds |
| YCharts Categorization | -- |
| YCharts Benchmark | -- |
| Prospectus Objective | Industrials Funds |
| Fund Owner Firm Name | T. Rowe Price |
| Broad Asset Class Benchmark Index | |
| ^MSWNTR | 100.0% |
Net Fund Flows Versus Peer Group
1 Month
% Rank:
86
-473.78M
Peer Group Low
984.49M
Peer Group High
1 Year
% Rank:
92
-14.78M
-1.371B
Peer Group Low
5.875B
Peer Group High
3 Months
% Rank:
93
-379.39M
Peer Group Low
3.651B
Peer Group High
3 Years
% Rank:
94
-1.645B
Peer Group Low
7.195B
Peer Group High
6 Months
% Rank:
95
-1.240B
Peer Group Low
3.666B
Peer Group High
5 Years
% Rank:
86
-2.439B
Peer Group Low
7.195B
Peer Group High
YTD
% Rank:
97
-187.31M
Peer Group Low
3.665B
Peer Group High
10 Years
% Rank:
37
-754.77M
Peer Group Low
7.211B
Peer Group High
Date Unavailable
Risk
Performance Versus Peer Group
Annual Total Returns Versus Peers
As of May 21, 2026.
Asset Allocation
As of March 31, 2026.
| Type | % Net |
|---|---|
| Cash | 2.31% |
| Stock | 97.60% |
| Bond | 0.32% |
| Convertible | 0.00% |
| Preferred | 0.00% |
| Other | -0.23% |
Top 10 Holdings
| Name | % Weight | Price | % Change |
|---|---|---|---|
| Tesla, Inc. | 5.27% | 417.81 | 0.13% |
| Caterpillar, Inc. | 3.77% | 865.73 | -0.78% |
| Airbus SE | 3.53% | 195.99 | -3.76% |
| Siemens AG | 3.53% | 303.36 | 2.48% |
| Deere & Co. | 2.37% | 531.21 | -5.22% |
| CSX Corp. | 2.25% | 45.90 | -0.10% |
| GE Aerospace | 2.23% | 301.81 | 0.55% |
| Renesas Electronics Corp. | 2.04% | 24.16 | 9.80% |
| Rolls-Royce Holdings Plc | 2.03% | 16.48 | 2.86% |
|
Other Fees
|
1.96% | -- | -- |
Fees & Availability
| Fees | |
| Actual 12B-1 Fee | -- |
| Actual Management Fee | 0.58% |
| Administration Fee | -- |
| Maximum Front Load | -- |
| Maximum Deferred Load | -- |
| Maximum Redemption Fee | -- |
| General Availability | |
| Available for Insurance Product | No |
| Available for RRSP | No |
| Purchase Details | |
| Open to New Investors |
|
| Minimum Initial Investment | 2500.00 None |
| Minimum Subsequent Investment | 100.00 None |
Basic Info
| Investment Strategy | |
| The Fund seeks to provide long-term growth of capital. The Fund invests at least 80% its net assets in securities issued by companies in the industrials sector and at least 40% of its net assets in securities issued by companies organized or located outside the US or doing a substantial amount of business outside the US. |
| General | |
| Security Type | Mutual Fund |
| Equity Style | Multi Cap Core |
| Broad Asset Class | Sector Equity |
| Broad Category | Equity |
| Global Peer Group | Equity Sector Industrials |
| Peer Group | Industrials Funds |
| Global Macro | Equity Industry Sector |
| US Macro | Sector Equity Funds |
| YCharts Categorization | -- |
| YCharts Benchmark | -- |
| Prospectus Objective | Industrials Funds |
| Fund Owner Firm Name | T. Rowe Price |
| Broad Asset Class Benchmark Index | |
| ^MSWNTR | 100.0% |
Fundamentals
| General | |
| Distribution Yield | -- |
| Dividend Yield TTM (5-20-26) | 0.20% |
| 30-Day SEC Yield | -- |
| 7-Day SEC Yield | -- |
| Number of Holdings | 105 |
| Stock | |
| Weighted Average PE Ratio | 30.51 |
| Weighted Average Price to Sales Ratio | 3.857 |
| Weighted Average Price to Book Ratio | 7.272 |
| Weighted Median ROE | 37.25% |
| Weighted Median ROA | 6.89% |
| ROI (TTM) | 10.29% |
| Return on Investment (TTM) | 10.29% |
| Earning Yield | 0.0393 |
| LT Debt / Shareholders Equity | 0.8342 |
| Number of Equity Holdings | 98 |
As of March 31, 2026
Growth Metrics
| EPS Growth (1Y) | 3.29% |
| EPS Growth (3Y) | 12.12% |
| EPS Growth (5Y) | 19.38% |
| Sales Growth (1Y) | 7.11% |
| Sales Growth (3Y) | 5.48% |
| Sales Growth (5Y) | 9.85% |
| Sales per Share Growth (1Y) | 8.17% |
| Sales per Share Growth (3Y) | 6.39% |
| Operating Cash Flow - Growth Rate (3Y) | 14.85% |
As of March 31, 2026
Fund Details
| Key Dates | |
| Inception Date | 10/24/2013 |
| Last Annual Report Date | 12/31/2025 |
| Last Prospectus Date | 3/1/2025 |
| Share Classes | |
| TRGAX | Inst |
| Attributes | |
| Index Fund | -- |
| Inverse Fund | No |
| Leveraged Fund | -- |
| Fund of Funds | No |
| Currency Hedged Fund | -- |
| Socially Responsible Fund | No |
Top Portfolio Holders
| Name | % Weight |
|---|---|
| Portfolio A | 5.00% |
| Portfolio B | 3.50% |
| Portfolio C | 2.25% |
Excel Add-In Codes
| Name: =YCI("M:RPGIX", "name") |
| Broad Asset Class: =YCI("M:RPGIX", "broad_asset_class") |
| Broad Category: =YCI("M:RPGIX", "broad_category_group") |
| Prospectus Objective: =YCI("M:RPGIX", "prospectus_objective") |
| To find the codes for any of our securities and financial metrics, see our Complete Excel Reference. |