

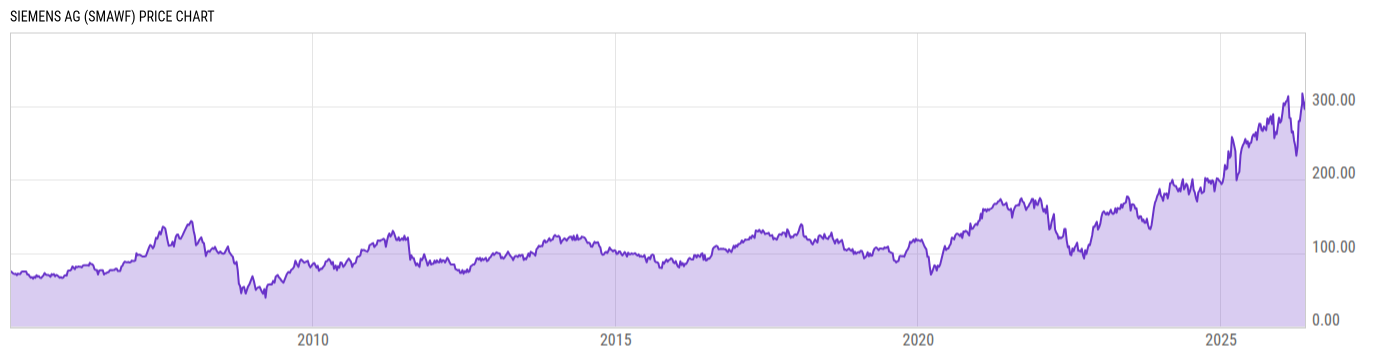
Siemens AG (SMAWF)
304.81
-0.25
(-0.08%)
USD |
OTCM |
Jun 08, 16:00
Price Chart
Key Stats
| Price and Performance | |
|---|---|
| Market Cap | 232.34B |
| 52 Week High (Daily) | |
| 52 Week Low (Daily) | |
| All-Time High (Daily) | |
| Year to Date Total Returns (Daily) | |
| 1 Month Total Returns (Daily) | |
| 1 Year Total Returns (Daily) | 23.01% |
| Valuation | |
| PE Ratio | 26.88 |
| PE Ratio (Forward) | |
| PS Ratio | 2.602 |
| Price to Book Value | 3.132 |
| EV to EBITDA | |
| Dividend | |
|---|---|
| Dividend | 6.346 |
| Dividend Yield (Forward) | |
| Financials | |
| Revenue (5 Year Growth) | |
| Revenue (Quarterly YoY Growth) | |
| EPS Diluted (5 Year Growth) | |
| EPS Diluted (Quarterly YoY Growth) | |
| Debt to Equity Ratio | 0.8412 |
| Return on Equity | |
| Return on Assets | |
| Risk | |
| Beta (5Y) | |
| Max Drawdown (5Y) | 46.42% |
Profile
| Siemens AG is a technology company, which engages in the areas of automation and digitalization. It operates through the following segments: Digital Industries, Smart Infrastructure, Mobility, Siemens Healthineers, and Siemens Financial Services. The Digital Industries segment offers a product portfolio and system solutions for automation used in discrete and process industries. The Smart Infrastructure segment includes products, systems, solutions, services and software to support a transition from fossil to renewable energy sources. The Mobility segment combines all Siemens businesses in passenger and freight transportation. The Siemens Healthineers segment develops, manufactures, and sells diagnostic and therapeutic products, and services to healthcare providers. The Siemens Financial Services segment focuses on financing solutions for Siemens’ customers as well as other companies in the form of debt and equity investments. The company was founded by Johann Georg Halske and Werner von Siemens on October 12, 1847 and is headquartered in Munich, Germany. |
| URL | http://www.siemens.de |
| Investor Relations URL | https://new.siemens.com/global/en/company/investor-relations.html |
| HQ State/Province | Bayern (Bavaria) |
| Sector | Industrials |
| Industry | Industrial Conglomerates |
| Next Earnings Release | Aug. 06, 2026 |
| Last Earnings Release | May. 13, 2026 |
| Next Ex-Dividend Date | N/A |
| Last Ex-Dividend Date | Feb. 13, 2026 |