

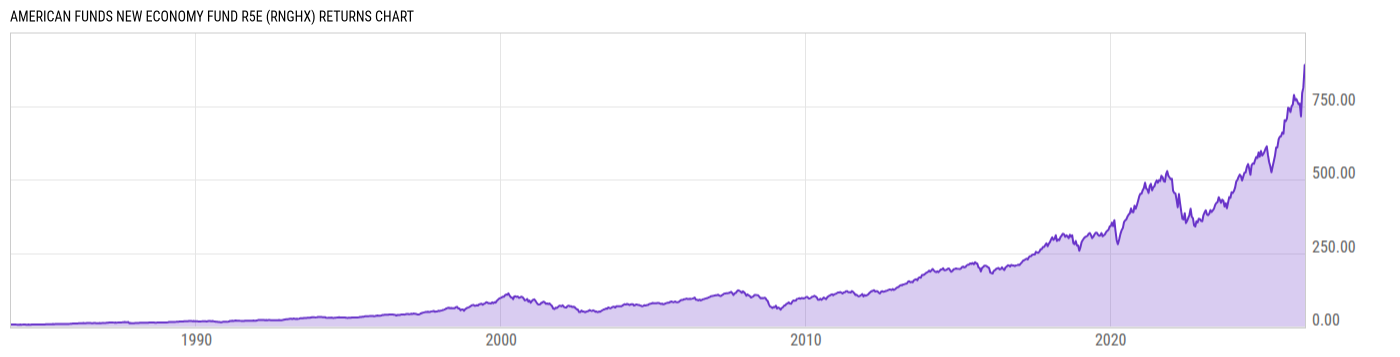
American Funds New Economy Fund R5E (RNGHX)
85.20
+0.40
(+0.47%)
USD |
Jun 09 2026
Returns Chart
Key Stats
| Net Expense Ratio | Total Assets Under Management | Weighted Average Dividend Yield | Turnover Ratio (Generic) |
|---|---|---|---|
| 0.55% | 51.39B | 0.67% | 36.00% |
| 1 Year Fund Level Flows | 1 Year Total Returns (Daily) | Annualized Total Returns Since Inception (Daily) | Max Drawdown (Since Inception) |
| -4.207B | 45.76% |
Basic Info
| Investment Strategy | |
| The Fund seeks long-term growth of capital. The Fund invests in securities of companies that can benefit from innovation, exploit new technologies or provide products and services that meet the demands of an evolving global economy. The Fund invests primarily in common stocks that have the potential for growth. |
| General | |
| Security Type | Mutual Fund |
| Equity Style | Multi Cap Growth |
| Broad Asset Class | International Equity |
| Broad Category | Equity |
| Global Peer Group | Equity Global |
| Peer Group | Global Multi-Cap Growth |
| Global Macro | Equity Global |
| US Macro | Developed Global Markets Funds |
| YCharts Categorization | -- |
| YCharts Benchmark | -- |
| Prospectus Objective | Global Funds |
| Fund Owner Firm Name | Capital Group/American Funds |
| Broad Asset Class Benchmark Index | |
| ^MSACXUSNTR | 100.0% |
Net Fund Flows Versus Peer Group
1 Month
% Rank:
95
-625.84M
Peer Group Low
230.11M
Peer Group High
1 Year
% Rank:
95
-4.207B
-4.207B
Peer Group Low
1.314B
Peer Group High
3 Months
% Rank:
95
-1.729B
Peer Group Low
749.03M
Peer Group High
3 Years
% Rank:
95
-7.319B
Peer Group Low
1.792B
Peer Group High
6 Months
% Rank:
95
-2.423B
Peer Group Low
927.64M
Peer Group High
5 Years
% Rank:
95
-8.165B
Peer Group Low
3.004B
Peer Group High
YTD
% Rank:
95
-1.877B
Peer Group Low
917.55M
Peer Group High
10 Years
% Rank:
95
-8.407B
Peer Group Low
7.385B
Peer Group High
Date Unavailable
Risk
Performance Versus Peer Group
Annual Total Returns Versus Peers
As of June 10, 2026.
Asset Allocation
As of March 31, 2026.
| Type | % Net |
|---|---|
| Cash | 7.62% |
| Stock | 89.61% |
| Bond | 0.01% |
| Convertible | 0.00% |
| Preferred | 1.84% |
| Other | 0.92% |
Top 10 Holdings
| Name | % Weight | Price | % Change |
|---|---|---|---|
|
Capital Group Central Cash Fund; Class M
|
7.62% | -- | -- |
| Broadcom Inc. | 4.99% | 392.16 | -1.12% |
| Micron Technology, Inc. | 3.92% | 935.89 | -1.41% |
|
SK Hynix Inc ORD
|
3.73% | -- | -- |
| NVIDIA Corp. | 3.37% | 208.19 | -0.22% |
| Taiwan Semiconductor Manufacturing Co., Ltd. | 2.89% | 17.24 | 0.00% |
| Taiwan Semiconductor Manufacturing Co., Ltd. | 2.74% | 427.92 | 0.26% |
| Alphabet, Inc. | 2.70% | 364.26 | 0.26% |
| Amazon.com, Inc. | 2.66% | 244.19 | -0.42% |
| Microsoft Corp. | 2.62% | 403.41 | -2.02% |
Fees & Availability
| Fees | |
| Actual 12B-1 Fee | -- |
| Actual Management Fee | 0.36% |
| Administration Fee | -- |
| Maximum Front Load | -- |
| Maximum Deferred Load | -- |
| Maximum Redemption Fee | -- |
| General Availability | |
| Available for Insurance Product | No |
| Available for RRSP | No |
| Purchase Details | |
| Open to New Investors |
|
| Minimum Initial Investment | 250.00 None |
| Minimum Subsequent Investment | 50.00 None |
Basic Info
| Investment Strategy | |
| The Fund seeks long-term growth of capital. The Fund invests in securities of companies that can benefit from innovation, exploit new technologies or provide products and services that meet the demands of an evolving global economy. The Fund invests primarily in common stocks that have the potential for growth. |
| General | |
| Security Type | Mutual Fund |
| Equity Style | Multi Cap Growth |
| Broad Asset Class | International Equity |
| Broad Category | Equity |
| Global Peer Group | Equity Global |
| Peer Group | Global Multi-Cap Growth |
| Global Macro | Equity Global |
| US Macro | Developed Global Markets Funds |
| YCharts Categorization | -- |
| YCharts Benchmark | -- |
| Prospectus Objective | Global Funds |
| Fund Owner Firm Name | Capital Group/American Funds |
| Broad Asset Class Benchmark Index | |
| ^MSACXUSNTR | 100.0% |
Fundamentals
| General | |
| Distribution Yield | -- |
| Dividend Yield TTM (6-8-26) | 0.27% |
| 30-Day SEC Yield (4-30-26) | 0.33% |
| 7-Day SEC Yield | -- |
| Number of Holdings | 177 |
| Stock | |
| Weighted Average PE Ratio | 32.81 |
| Weighted Average Price to Sales Ratio | 8.887 |
| Weighted Average Price to Book Ratio | 10.05 |
| Weighted Median ROE | 33.32% |
| Weighted Median ROA | 16.50% |
| ROI (TTM) | 21.93% |
| Return on Investment (TTM) | 21.93% |
| Earning Yield | 0.0391 |
| LT Debt / Shareholders Equity | 0.6265 |
| Number of Equity Holdings | 172 |
As of March 31, 2026
Growth Metrics
| EPS Growth (1Y) | 42.71% |
| EPS Growth (3Y) | 26.95% |
| EPS Growth (5Y) | 30.55% |
| Sales Growth (1Y) | 24.47% |
| Sales Growth (3Y) | 18.76% |
| Sales Growth (5Y) | 20.35% |
| Sales per Share Growth (1Y) | 23.11% |
| Sales per Share Growth (3Y) | 17.96% |
| Operating Cash Flow - Growth Rate (3Y) | 27.34% |
As of March 31, 2026
Fund Details
| Key Dates | |
| Inception Date | 12/1/1983 |
| Last Annual Report Date | 11/30/2025 |
| Last Prospectus Date | 2/1/2026 |
| Share Classes | |
| ANEFX | A |
| ANFCX | C |
| ANFFX | Other |
| CNGAX | 529 Plans |
| CNGCX | 529 Plans |
| CNGEX | 529 Plans |
| CNGFX | 529 Plans |
| FNEEX | 529 Plans |
| FNEFX | F3 |
| FNNEX | 529 Plans |
| NEFFX | Other |
| RNGAX | Retirement |
| RNGBX | Retirement |
| RNGCX | Retirement |
| RNGEX | Retirement |
| RNGFX | Retirement |
| RNGGX | Retirement |
| RNNEX | Other |
| Attributes | |
| Index Fund | -- |
| Inverse Fund | No |
| Leveraged Fund | -- |
| Fund of Funds | No |
| Currency Hedged Fund | -- |
| Socially Responsible Fund | No |
Top Portfolio Holders
| Name | % Weight |
|---|---|
| Portfolio A | 5.00% |
| Portfolio B | 3.50% |
| Portfolio C | 2.25% |
Excel Add-In Codes
| Name: =YCI("M:RNGHX", "name") |
| Broad Asset Class: =YCI("M:RNGHX", "broad_asset_class") |
| Broad Category: =YCI("M:RNGHX", "broad_category_group") |
| Prospectus Objective: =YCI("M:RNGHX", "prospectus_objective") |
| To find the codes for any of our securities and financial metrics, see our Complete Excel Reference. |