

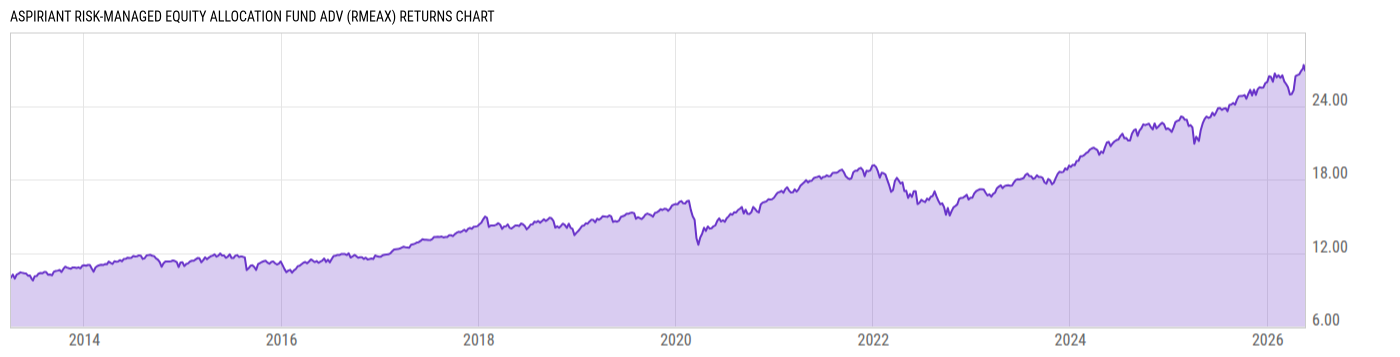
Aspiriant Risk-Managed Equity Allocation Fund Adv (RMEAX)
17.13
+0.02
(+0.12%)
USD |
Jun 09 2026
Returns Chart
Key Stats
| Net Expense Ratio | Total Assets Under Management | Weighted Average Dividend Yield | Turnover Ratio (Generic) |
|---|---|---|---|
| 1.24% | 1.391B | -- | 19.00% |
| 1 Year Fund Level Flows | 1 Year Total Returns (Daily) | Annualized Total Returns Since Inception (Daily) | Max Drawdown (Since Inception) |
| -164.45M | 16.56% |
Basic Info
| Investment Strategy | |
| The Fund seeks long-term capital appreciation while considering federal tax implications of investment decisions. The Fund will hold a broad and diverse group of equity securities of companies in countries with developed and emerging markets with greater emphasis on small capitalization and value companies. |
| General | |
| Security Type | Mutual Fund |
| Equity Style | -- |
| Broad Asset Class | International Equity |
| Broad Category | Equity |
| Global Peer Group | Equity Global |
| Peer Group | Global Multi-Cap Core |
| Global Macro | Equity Global |
| US Macro | Developed Global Markets Funds |
| YCharts Categorization | -- |
| YCharts Benchmark | -- |
| Prospectus Objective | Global Funds |
| Fund Owner Firm Name | Aspiriant |
| Broad Asset Class Benchmark Index | |
| ^MSACXUSNTR | 100.0% |
Net Fund Flows Versus Peer Group
1 Month
% Rank:
24
-1.029B
Peer Group Low
958.06M
Peer Group High
1 Year
% Rank:
84
-164.45M
-15.02B
Peer Group Low
16.56B
Peer Group High
3 Months
% Rank:
66
-3.846B
Peer Group Low
5.660B
Peer Group High
3 Years
% Rank:
88
-38.52B
Peer Group Low
26.07B
Peer Group High
6 Months
% Rank:
91
-7.621B
Peer Group Low
10.34B
Peer Group High
5 Years
% Rank:
86
-57.87B
Peer Group Low
35.43B
Peer Group High
YTD
% Rank:
24
-5.752B
Peer Group Low
8.854B
Peer Group High
10 Years
% Rank:
73
-114.77B
Peer Group Low
46.61B
Peer Group High
Date Unavailable
Risk
Performance Versus Peer Group
Annual Total Returns Versus Peers
As of June 10, 2026.
Asset Allocation
As of March 31, 2026.
| Type | % Net |
|---|---|
| Cash | 3.34% |
| Stock | 85.10% |
| Bond | 3.51% |
| Convertible | 0.00% |
| Preferred | 0.63% |
| Other | 7.41% |
Top 10 Holdings
| Name | % Weight | Price | % Change |
|---|---|---|---|
| GMO Quality Fund VI | 33.37% | 36.56 | 0.19% |
| Schwab Fundamental EM Equity ETF | 7.64% | 39.80 | -0.88% |
|
Rief Strategic Partners Fund
|
7.16% | -- | -- |
| Baillie Gifford Emerging Markets Equities Fund K | 5.01% | 32.56 | 0.68% |
| GMO Equity Dislocation Investment A USD | 4.78% | 27.45 | 0.29% |
| AQR Large Cap Defensive Style Fund R6 | 4.04% | 18.50 | 0.16% |
|
Viking Global Equities LP
|
3.92% | -- | -- |
| JPMorgan Prime Money Market Fund Institutional | 3.43% | 1.000 | 0.01% |
| iShares MSCI Global Min Vol Factor ETF | 3.11% | 120.90 | -0.10% |
| iShares MSCI ACWI ETF | 2.32% | 152.24 | -1.53% |
Fees & Availability
| Fees | |
| Actual 12B-1 Fee | -- |
| Actual Management Fee | 0.11% |
| Administration Fee | 913.6K% |
| Maximum Front Load | -- |
| Maximum Deferred Load | -- |
| Maximum Redemption Fee | -- |
| General Availability | |
| Available for Insurance Product | No |
| Available for RRSP | No |
| Purchase Details | |
| Open to New Investors |
|
| Minimum Initial Investment | 0.00 None |
| Minimum Subsequent Investment | 0.00 None |
Basic Info
| Investment Strategy | |
| The Fund seeks long-term capital appreciation while considering federal tax implications of investment decisions. The Fund will hold a broad and diverse group of equity securities of companies in countries with developed and emerging markets with greater emphasis on small capitalization and value companies. |
| General | |
| Security Type | Mutual Fund |
| Equity Style | -- |
| Broad Asset Class | International Equity |
| Broad Category | Equity |
| Global Peer Group | Equity Global |
| Peer Group | Global Multi-Cap Core |
| Global Macro | Equity Global |
| US Macro | Developed Global Markets Funds |
| YCharts Categorization | -- |
| YCharts Benchmark | -- |
| Prospectus Objective | Global Funds |
| Fund Owner Firm Name | Aspiriant |
| Broad Asset Class Benchmark Index | |
| ^MSACXUSNTR | 100.0% |
Fundamentals
| General | |
| Distribution Yield | -- |
| Dividend Yield TTM (6-8-26) | 1.60% |
| 30-Day SEC Yield | -- |
| 7-Day SEC Yield | -- |
| Number of Holdings | 129 |
| Stock | |
| Weighted Average PE Ratio | 26.55 |
| Weighted Average Price to Sales Ratio | 6.471 |
| Weighted Average Price to Book Ratio | 7.806 |
| Weighted Median ROE | 45.90% |
| Weighted Median ROA | 13.12% |
| ROI (TTM) | 19.30% |
| Return on Investment (TTM) | 19.30% |
| Earning Yield | 0.0502 |
| LT Debt / Shareholders Equity | 0.6064 |
| Number of Equity Holdings | 109 |
As of March 31, 2026
Growth Metrics
| EPS Growth (1Y) | 22.43% |
| EPS Growth (3Y) | 12.74% |
| EPS Growth (5Y) | 20.50% |
| Sales Growth (1Y) | 12.01% |
| Sales Growth (3Y) | 10.40% |
| Sales Growth (5Y) | 12.27% |
| Sales per Share Growth (1Y) | 13.68% |
| Sales per Share Growth (3Y) | 12.16% |
| Operating Cash Flow - Growth Rate (3Y) | 15.01% |
As of March 31, 2026
Fund Details
| Key Dates | |
| Inception Date | 4/4/2013 |
| Last Annual Report Date | 3/31/2025 |
| Last Prospectus Date | 8/1/2025 |
| Attributes | |
| Index Fund | -- |
| Inverse Fund | No |
| Leveraged Fund | -- |
| Fund of Funds | No |
| Currency Hedged Fund | -- |
| Socially Responsible Fund | No |
Top Portfolio Holders
| Name | % Weight |
|---|---|
| Portfolio A | 5.00% |
| Portfolio B | 3.50% |
| Portfolio C | 2.25% |
Excel Add-In Codes
| Name: =YCI("M:RMEAX", "name") |
| Broad Asset Class: =YCI("M:RMEAX", "broad_asset_class") |
| Broad Category: =YCI("M:RMEAX", "broad_category_group") |
| Prospectus Objective: =YCI("M:RMEAX", "prospectus_objective") |
| To find the codes for any of our securities and financial metrics, see our Complete Excel Reference. |