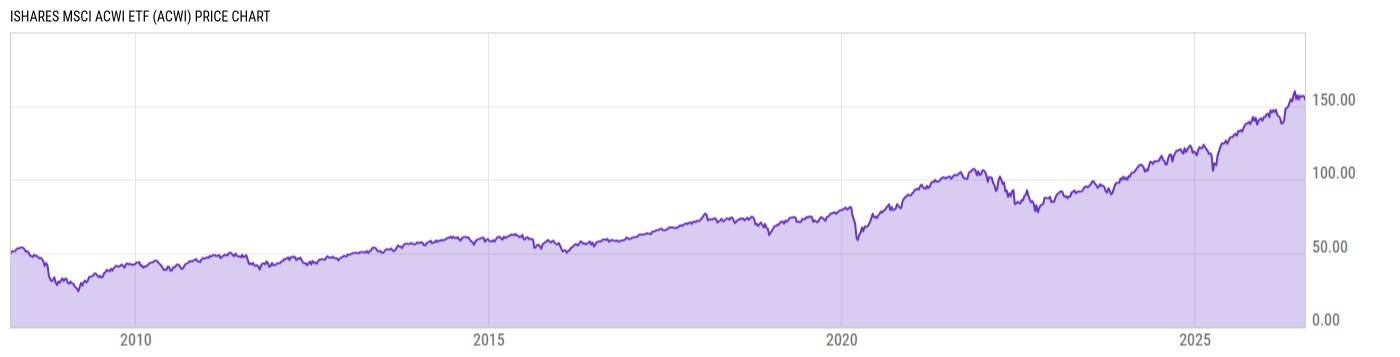
iShares MSCI ACWI ETF (ACWI)
94.21
+0.02 (+0.02%)
USD |
Jan 21, 20:00
Price Chart
Key Stats
Customize
Expense Ratio | Discount or Premium to NAV | Total Assets Under Management | 30-Day Average Daily Volume |
---|---|---|---|
0.32% | 0.17% | 14.88B | 3.347M |
Dividend Yield | Turnover Ratio | 1 Year Fund Level Flows | Max Drawdown (All) |
1.38% | 16.00% | 622.77M | Upgrade |
Basic Info
Investment Strategy | |
The investment seeks to track the investment results of the MSCI ACWI composed of large- and mid-capitalization developed and emerging market equities. The fund generally will invest at least 90% of its assets in the component securities of the underlying index and in investments that have economic characteristics that are substantially identical to the component securities of the underlying index. The index is a free float-adjusted market capitalization index designed to measure the combined equity market performance of developed and emerging markets countries. |
General | |
Security Type | Exchange-Traded Fund |
Equity Style | Large Cap/Blend |
Fixed Income Style | -- |
Broad Asset Class | International Equity |
Broad Category | Equity |
Category Name | World Large Stock |
Category Index | MSCI ACWI Large Cap NR USD |
Prospectus Objective | World Stock |
Fund Owner Firm Name | iShares |
Prospectus Benchmark Index | |
MSCI ACWI NR USD | 100.0% |
Broad Asset Class Benchmark Index | |
^MSACXUSNTR | 100.0% |
Manager Tenure | |
Greg Savage | 12.78 yrs |
Jennifer Hsui | 8.09 yrs |
Alan Mason | 4.72 yrs |
Amy Whitelaw | 2.09 yrs |
Rachel Aguirre | 2.09 yrs |
Net Fund Flows Versus Category
1 Month
% Rank:
--
--
Category Low
--
Category High
1 Year
% Rank:
3
622.77M
-6.908B
Category Low
2.056B
Category High
3 Months
% Rank:
--
--
Category Low
--
Category High
3 Years
% Rank:
--
--
Category Low
--
Category High
6 Months
% Rank:
--
--
Category Low
--
Category High
5 Years
% Rank:
--
--
Category Low
--
Category High
YTD
% Rank:
--
--
Category Low
--
Category High
10 Years
% Rank:
--
--
Category Low
--
Category High
As of December 31, 2020
Performance Versus Category
As of January 20, 2021. Returns for periods of 1 year and above are annualized.
Annual Total Returns Versus Peers
Edit comparables
As of January 20, 2021.
Asset Allocation
Top 10 Holdings
Name | % Weight | Price | % Change |
---|---|---|---|
Apple Inc | 3.61% | 136.87 | 3.67% |
Microsoft Corp | 2.53% | 224.97 | 0.28% |
Amazon.com Inc | 2.19% | 3306.99 | 1.34% |
Tesla Inc | 1.02% | 844.99 | -0.64% |
Facebook Inc A | 1.00% | 272.87 | 2.02% |
iShares MSCI India ETF | 0.94% | 41.80 | -0.45% |
Taiwan Semiconductor Manufacturing Co Ltd
|
0.88% | -- | -- |
Alphabet Inc Class C | 0.87% | 1891.25 | 0.23% |
Alphabet Inc A | 0.86% | 1884.15 | 0.22% |
Tencent Holdings Ltd
|
0.80% | -- | -- |
News
Headline
Wire
Time (ET)
PR Newswire
12/11 09:00
SA Breaking News
09/24 02:35
Basic Info
Investment Strategy | |
The investment seeks to track the investment results of the MSCI ACWI composed of large- and mid-capitalization developed and emerging market equities. The fund generally will invest at least 90% of its assets in the component securities of the underlying index and in investments that have economic characteristics that are substantially identical to the component securities of the underlying index. The index is a free float-adjusted market capitalization index designed to measure the combined equity market performance of developed and emerging markets countries. |
General | |
Security Type | Exchange-Traded Fund |
Equity Style | Large Cap/Blend |
Fixed Income Style | -- |
Broad Asset Class | International Equity |
Broad Category | Equity |
Category Name | World Large Stock |
Category Index | MSCI ACWI Large Cap NR USD |
Prospectus Objective | World Stock |
Fund Owner Firm Name | iShares |
Prospectus Benchmark Index | |
MSCI ACWI NR USD | 100.0% |
Broad Asset Class Benchmark Index | |
^MSACXUSNTR | 100.0% |
Manager Tenure | |
Greg Savage | 12.78 yrs |
Jennifer Hsui | 8.09 yrs |
Alan Mason | 4.72 yrs |
Amy Whitelaw | 2.09 yrs |
Rachel Aguirre | 2.09 yrs |
Fundamentals
General | |
Distribution Yield | Upgrade |
Dividend Yield TTM (1-21-21) | 1.38% |
30-Day SEC Yield (3-31-20) | Upgrade |
7-Day SEC Yield | -- |
Number of Holdings | Upgrade |
Stock | |
Weighted Average PE Ratio | 24.58 |
Weighted Average Price to Sales Ratio | Upgrade |
Weighted Average Price to Book Ratio | Upgrade |
Weighted Median ROE | Upgrade |
Weighted Median ROA | Upgrade |
Forecasted Dividend Yield | Upgrade |
Forecasted PE Ratio | Upgrade |
Forecasted Price to Sales Ratio | Upgrade |
Forecasted Price to Book Ratio | Upgrade |
As of January 20, 2021
Growth Estimates
Fund Details
Key Dates | |
Inception Date | 3/26/2008 |
Last Annual Report Date | 7/31/2020 |
Last Prospectus Date | 12/1/2020 |
Attributes | |
Enhanced Index Fund | No |
Index Fund |
|
Inverse Fund | No |
Leveraged Fund | No |
Fund of Funds | No |
Currency Hedged Fund | No |
Synthetic Replication Fund | No |
Has Dividend Investment Plan | No |
Socially Responsible Fund | No |
News
Headline
Wire
Time (ET)
PR Newswire
12/11 09:00
SA Breaking News
09/24 02:35