

Principal SAM Strategic Growth Portfolio R-5 (PSGFX)
24.00
0.00 (0.00%)
USD |
May 27 2026
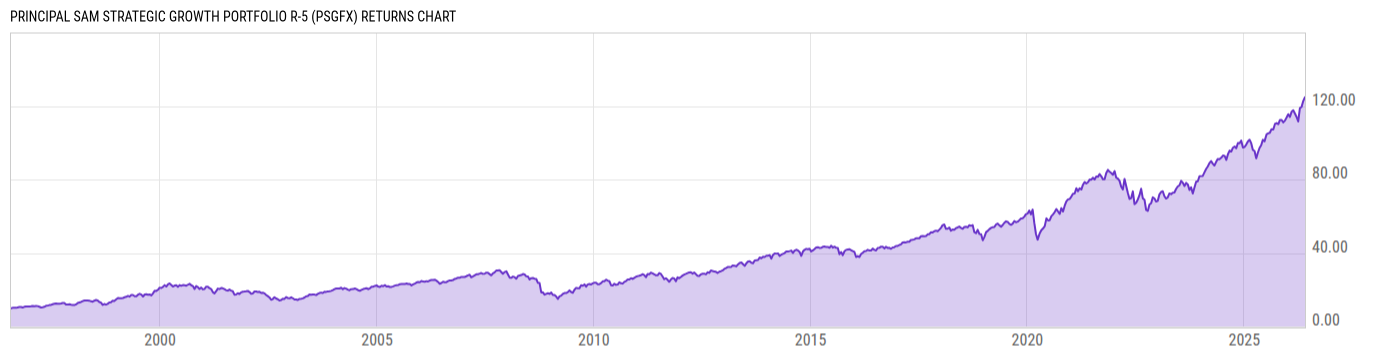
Returns Chart
Key Stats
| Net Expense Ratio | Total Assets Under Management | Weighted Average Dividend Yield | Turnover Ratio (Generic) |
|---|---|---|---|
| 1.06% | 2.628B | -- | 45.00% |
| 1 Year Fund Level Flows | 1 Year Total Returns (Daily) | Annualized Total Returns Since Inception (Daily) | Max Drawdown (Since Inception) |
| -170.30M | 24.36% |
Basic Info
| Investment Strategy | |
| The Portfolio seeks to provide long-term capital appreciation with the potential for higher levels of capital growth, while subjecting investors to corresponding levels of principal risk. |
| General | |
| Security Type | Mutual Fund |
| Equity Style | -- |
| Broad Asset Class | Allocation |
| Broad Category | Allocation |
| Global Peer Group | Mixed Asset USD Aggressive |
| Peer Group | Mixed-Asset Target Alloc Agg Gro Funds |
| Global Macro | Mixed Asset HC Aggressive |
| US Macro | Mixed-Assets Target Allocation Funds |
| YCharts Categorization | -- |
| YCharts Benchmark | -- |
| Prospectus Objective | Growth Funds |
| Fund Owner Firm Name | Principal |
| Broad Asset Class Benchmark Index | |
| ^SPXTR | 100.0% |
Net Fund Flows Versus Peer Group
1 Month
% Rank:
90
-46.59M
Peer Group Low
425.01M
Peer Group High
1 Year
% Rank:
80
-170.30M
-502.07M
Peer Group Low
690.68M
Peer Group High
3 Months
% Rank:
84
-137.67M
Peer Group Low
425.01M
Peer Group High
3 Years
% Rank:
78
-1.688B
Peer Group Low
858.19M
Peer Group High
6 Months
% Rank:
84
-281.84M
Peer Group Low
542.50M
Peer Group High
5 Years
% Rank:
82
-2.460B
Peer Group Low
1.040B
Peer Group High
YTD
% Rank:
85
-186.03M
Peer Group Low
425.01M
Peer Group High
10 Years
% Rank:
91
-4.493B
Peer Group Low
1.383B
Peer Group High
Date Unavailable
Risk
Performance Versus Peer Group
Annual Total Returns Versus Peers
As of May 28, 2026.
Asset Allocation
As of April 30, 2026.
| Type | % Net |
|---|---|
| Cash | 0.67% |
| Stock | 95.92% |
| Bond | 1.83% |
| Convertible | 0.00% |
| Preferred | 0.33% |
| Other | 1.26% |
Top 10 Holdings
| Name | % Weight | Price | % Change |
|---|---|---|---|
| Principal US Mega-Cap ETF | 14.92% | 74.11 | 0.22% |
| Principal Capital Appreciation Fund Institutional | 13.42% | 93.93 | -0.15% |
| Principal Equity Income Fund Inst | 11.87% | 44.37 | 0.00% |
| Principal Global Emerging Markets Fund R-6 | 11.23% | 42.20 | 0.50% |
| Principal Overseas Fund Institutional | 8.12% | 13.32 | 0.00% |
| Principal International Equity ETF | 7.81% | 35.82 | 0.84% |
| Principal U.S. Small-Cap ETF | 6.22% | 65.83 | 0.11% |
| Principal LargeCap Value Fund III Inst | 5.46% | 18.77 | -0.05% |
| Principal LargeCap S&P 500 Index Fund Inst | 5.39% | 35.72 | 0.03% |
| Principal International Equity Index Fund R-6 | 3.31% | 15.20 | -0.33% |
Fees & Availability
| Fees | |
| Actual 12B-1 Fee | -- |
| Actual Management Fee | 0.27% |
| Administration Fee | 3.00K% |
| Maximum Front Load | -- |
| Maximum Deferred Load | -- |
| Maximum Redemption Fee | -- |
| General Availability | |
| Available for Insurance Product | No |
| Available for RRSP | No |
| Purchase Details | |
| Open to New Investors |
|
| Minimum Initial Investment | 0.00 None |
| Minimum Subsequent Investment | 0.00 None |
Basic Info
| Investment Strategy | |
| The Portfolio seeks to provide long-term capital appreciation with the potential for higher levels of capital growth, while subjecting investors to corresponding levels of principal risk. |
| General | |
| Security Type | Mutual Fund |
| Equity Style | -- |
| Broad Asset Class | Allocation |
| Broad Category | Allocation |
| Global Peer Group | Mixed Asset USD Aggressive |
| Peer Group | Mixed-Asset Target Alloc Agg Gro Funds |
| Global Macro | Mixed Asset HC Aggressive |
| US Macro | Mixed-Assets Target Allocation Funds |
| YCharts Categorization | -- |
| YCharts Benchmark | -- |
| Prospectus Objective | Growth Funds |
| Fund Owner Firm Name | Principal |
| Broad Asset Class Benchmark Index | |
| ^SPXTR | 100.0% |
Fundamentals
| General | |
| Distribution Yield | -- |
| Dividend Yield TTM (5-26-26) | 1.20% |
| 30-Day SEC Yield (4-30-26) | 0.72% |
| 7-Day SEC Yield | -- |
| Number of Holdings | 23 |
| Stock | |
| Weighted Average PE Ratio | 29.24 |
| Weighted Average Price to Sales Ratio | 7.105 |
| Weighted Average Price to Book Ratio | 7.994 |
| Weighted Median ROE | 107.8% |
| Weighted Median ROA | 12.62% |
| ROI (TTM) | 19.12% |
| Return on Investment (TTM) | 19.12% |
| Earning Yield | 0.0446 |
| LT Debt / Shareholders Equity | 0.7106 |
| Number of Equity Holdings | 0 |
As of April 30, 2026
Growth Metrics
| EPS Growth (1Y) | 23.20% |
| EPS Growth (3Y) | 16.64% |
| EPS Growth (5Y) | 21.00% |
| Sales Growth (1Y) | 12.73% |
| Sales Growth (3Y) | 12.24% |
| Sales Growth (5Y) | 13.91% |
| Sales per Share Growth (1Y) | 20.10% |
| Sales per Share Growth (3Y) | 12.83% |
| Operating Cash Flow - Growth Rate (3Y) | 19.83% |
As of April 30, 2026
Fund Details
Top Portfolio Holders
| Name | % Weight |
|---|---|
| Portfolio A | 5.00% |
| Portfolio B | 3.50% |
| Portfolio C | 2.25% |
Excel Add-In Codes
| Name: =YCI("M:PSGFX", "name") |
| Broad Asset Class: =YCI("M:PSGFX", "broad_asset_class") |
| Broad Category: =YCI("M:PSGFX", "broad_category_group") |
| Prospectus Objective: =YCI("M:PSGFX", "prospectus_objective") |
| To find the codes for any of our securities and financial metrics, see our Complete Excel Reference. |